

Sample Category Title
USD/JPY Support Holds Strong As Bulls Target A Fresh Breakout
Key Highlights
- USD/JPY remained supported and climbed above 159.80.
- A bullish trend line is forming with support at 159.70 on the 1-hour chart.
- EUR/USD is struggling to clear the 1.1680 resistance zone.
- Bitcoin declined heavily and tested the $62,000 support.
USD/JPY Technical Analysis
The US Dollar remained well bid above 159.20 against the Japanese Yen. USD/JPY climbed above the 159.50 and 159.60 resistance levels.
Looking at the 1-hour chart, the pair gained strength for a move toward 160.00. A high was formed at 160.04, and the pair is now consolidating gains near the 23.6% Fib retracement level of the upward move from the 159.54 swing low to the 160.04 high.
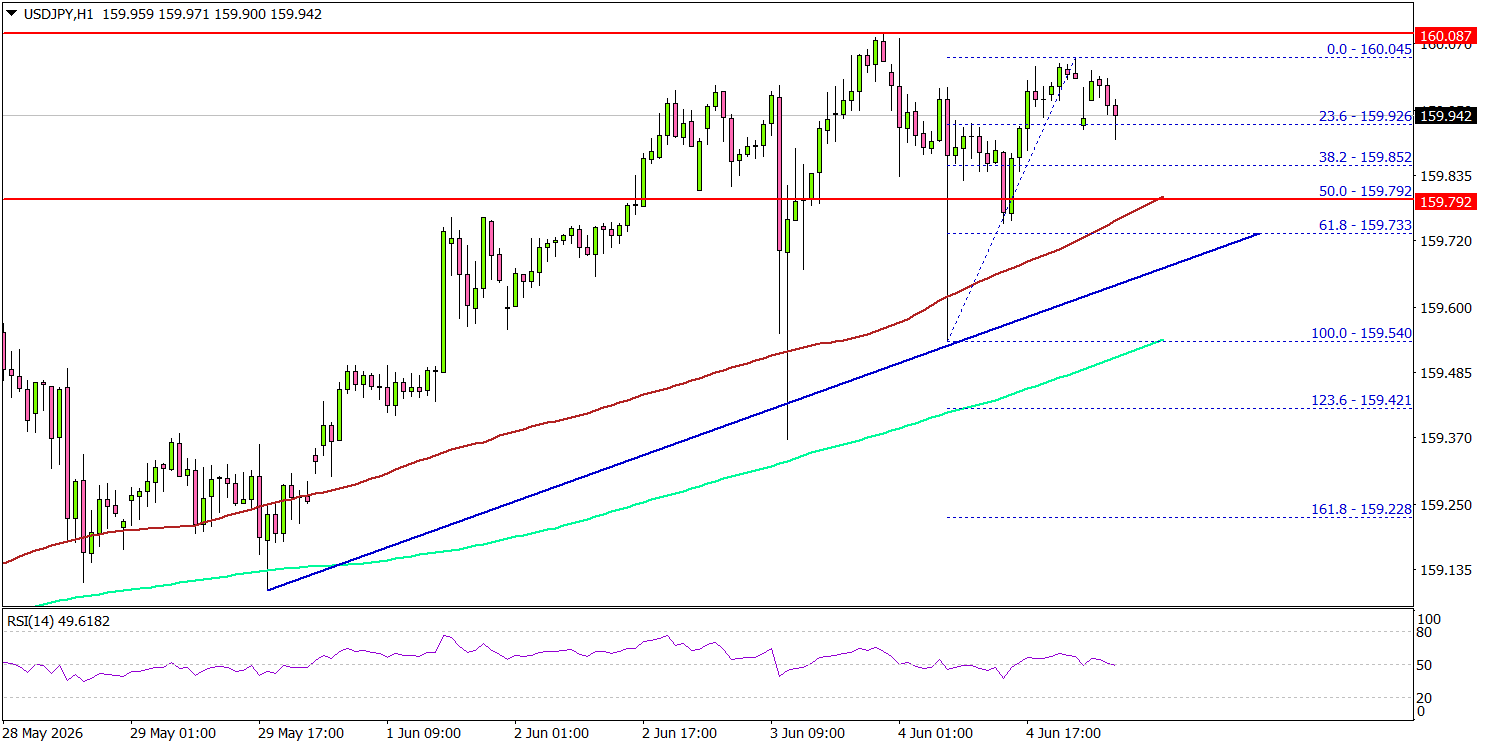
On the downside, the pair could find bids near 159.80, the 100 simple moving average (red, 4-hour), and the 50% Fib retracement level of the upward move from the 159.54 swing low to the 160.04 high.
The first major support might be 159.70. A close below 159.70 might initiate a drop to 159.20 and the 200 simple moving average (green, 4-hour). Any more losses might open the doors for a drop toward the 158.80 zone.
On the upside, an immediate resistance could be 160.00. The next major resistance might be 160.50. A close above 160.50 could open doors for gains above 161.20. In the stated case, the bulls could aim for a move to 162.00.
Looking at EUR/USD, the pair failed to continue higher, started a fresh decline, and might move below the 1.1575 support.
Upcoming Key Economic Events:
- US nonfarm payrolls for May 2026 – Forecast 85K, versus 115K previous.
- US Unemployment Rate for May 2026 - Forecast 4.3%, versus 4.3% previous.
Eco Data 6/5/26
| GMT | Ccy | Events | Act | Cons | Prev | Rev |
|---|---|---|---|---|---|---|
| 23:30 | JPY | Labor Cash Earnings Y/Y Apr | 3.50% | 3.20% | 2.70% | 3.10% |
| 23:30 | JPY | Overall Household Spending Y/Y Apr | -0.50% | -1.40% | -2.90% | |
| 05:00 | JPY | Leading Economic Index Apr P | 115.9 | 114.3 | 114 | |
| 07:00 | CHF | Foreign Currency Reserves (CHF) May | 711B | 716B | ||
| 09:00 | EUR | Eurozone GDP Q/Q Q1 F | -0.20% | 0.10% | 0.10% | |
| 12:30 | USD | Nonfarm Payrolls May | 172K | 85K | 115K | 179K |
| 12:30 | USD | Unemployment Rate May | 4.30% | 4.30% | 4.30% | |
| 12:30 | USD | Average Hourly Earnings M/M May | 0.30% | 0.30% | 0.20% | |
| 12:30 | CAD | Net Change in Employment May | 87.8K | 10.2K | -17.7K | |
| 12:30 | CAD | Unemployment Rate May | 6.60% | 6.90% | 6.90% | |
| 14:00 | CAD | Ivey PMI May | 58.2 | 55 | 57.7 |
| 23:30 | JPY |
| Labor Cash Earnings Y/Y Apr | |
| Actual | 3.50% |
| Consensus | 3.20% |
| Previous | 2.70% |
| Revised | 3.10% |
| 23:30 | JPY |
| Overall Household Spending Y/Y Apr | |
| Actual | -0.50% |
| Consensus | -1.40% |
| Previous | -2.90% |
| 05:00 | JPY |
| Leading Economic Index Apr P | |
| Actual | 115.9 |
| Consensus | 114.3 |
| Previous | 114 |
| 07:00 | CHF |
| Foreign Currency Reserves (CHF) May | |
| Actual | 711B |
| Consensus | |
| Previous | 716B |
| 09:00 | EUR |
| Eurozone GDP Q/Q Q1 F | |
| Actual | -0.20% |
| Consensus | 0.10% |
| Previous | 0.10% |
| 12:30 | USD |
| Nonfarm Payrolls May | |
| Actual | 172K |
| Consensus | 85K |
| Previous | 115K |
| Revised | 179K |
| 12:30 | USD |
| Unemployment Rate May | |
| Actual | 4.30% |
| Consensus | 4.30% |
| Previous | 4.30% |
| 12:30 | USD |
| Average Hourly Earnings M/M May | |
| Actual | 0.30% |
| Consensus | 0.30% |
| Previous | 0.20% |
| 12:30 | CAD |
| Net Change in Employment May | |
| Actual | 87.8K |
| Consensus | 10.2K |
| Previous | -17.7K |
| 12:30 | CAD |
| Unemployment Rate May | |
| Actual | 6.60% |
| Consensus | 6.90% |
| Previous | 6.90% |
| 14:00 | CAD |
| Ivey PMI May | |
| Actual | 58.2 |
| Consensus | 55 |
| Previous | 57.7 |
Weekly Focus – Rate Hikes Coming from the Big Central Banks
Last week's optimism on a reopening of the Strait of Hormuz faded this week as both US and Iran officials toned down the prospect of agreement and military action flared up again, including in Lebanon. The oil price is back above USD 97 for Brent. In our new economic forecasts published this week, we have assumed a very gradual normalisation of oil prices over several years in line with market pricing, which implies that there is some progress in getting shipments through the Strait but not a real solution soon. Clearly, there are risks in both directions from this.
Economic data from the US has been to the positive side this week, with the ISM survey pointing to increasing manufacturing production and employment, job openings higher than expected and the unofficial ADP employment report showing 122,000 private sector jobs added in May. However, the most important data point will be the Friday job report. The US economy continues to be boosted by tech-related investments which is also reflected in the stock market, where the strong performance of tech stocks continues. The US Treasury announced the result of their so-called Section 301 investigation of 60 economies regarding forced labour, which paves the way for replacing the current 10% tariffs when they expire on 24 July. However, also these tariffs are likely be to challenged in the courts. Currently, there is close to zero net revenue from tariffs, as incomes are matched by refunds of tariffs that have previously been found to be illegal. Hence, US fiscal policy is more expansionary than intended, which is part of the reason we now expect the next move from the Fed to be a hike.
In the euro area, May inflation rose to 3.2% y/y as expected, but perhaps more worryingly for the ECB, services inflation rose to 3.5% from 3.0% y/y, a bigger rise than can be explained by technical factors such as the timing of Easter. The extremely weak May PMI numbers for the service sector were revised up significantly, but the aggregate number of 48.5 still point to contraction. The ECB has quite clearly signalled that it will hike rates by 25bp at its meeting next week, where it will also present updated economic projections. These will likely reflect the same dilemma as the May data, namely that the economy is weakening but inflation is rising, both related to higher oil prices than in the bank's latest base case scenario from March. Hence, uncertainty remains as to whether and when there will be another rate hike, but we do not expect to get clear guidance from the ECB on that.
A string of other central banks will follow with rate announcements. In the Fed, Kevin Warsh will host his first press conference as chairman. He has expressed scepticism of guidance tools such as the so-called dot plot of FOCM member expectations which are due to be updated at this meeting. Expectations of an autumn rate hike are increasing, though.
We expect the Bank of Japan to hike its policy rate to 1%, the highest since 1995. Hawks on the policy board have become more outspoken recently, and real wage growth has finally turned positive.
Weekly Focus will not be published next week, so the next issue will be on 19 June.
ECB Preview: And So, The Hiking Begins
- We expect the ECB to hike the deposit rate by 25bp to 2.25% on Thursday 11 June in line with consensus and markets.
- We expect Lagarde to keep full optionality on the future policy rate path, including a potential summer hike but not pre-committing.
- We expect a final 25bp hike in Q3 bringing the deposit rate to 2.50%.
We expect the ECB to hike policy rates by 25bp, bringing the deposit rate to 2.25% on June 11 in line with market pricing and consensus. The recent communication from ECB’s GC members have clearly signalled a rate hike in June, both from the hawkish and dovish side of the spectrum. The size and particularly the persistency of the energy shock means that “We can no longer look through this shock. The risk of deanchoring inflation expectations is rising”, according to Schnabel. The main reason for ECB hiking is thereby to keep inflation expectations anchored by signalling a willingness to act.
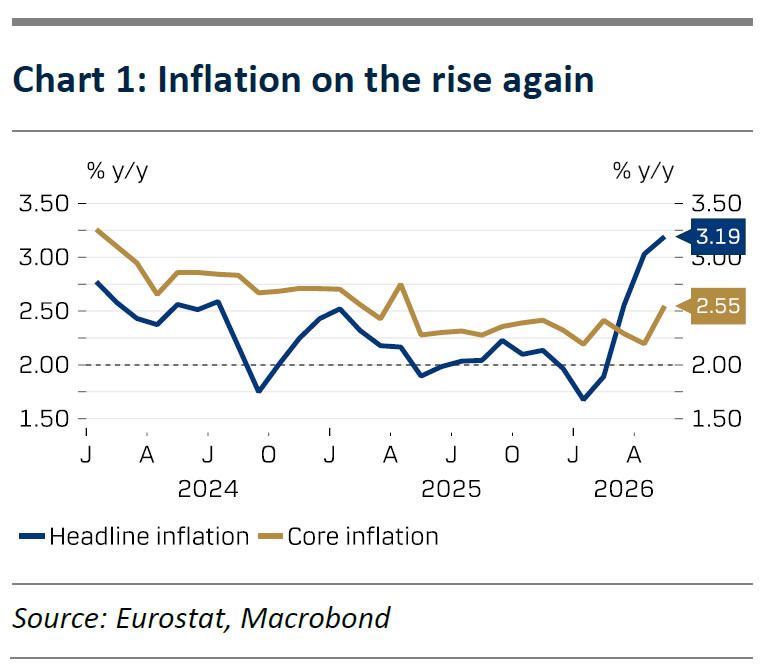
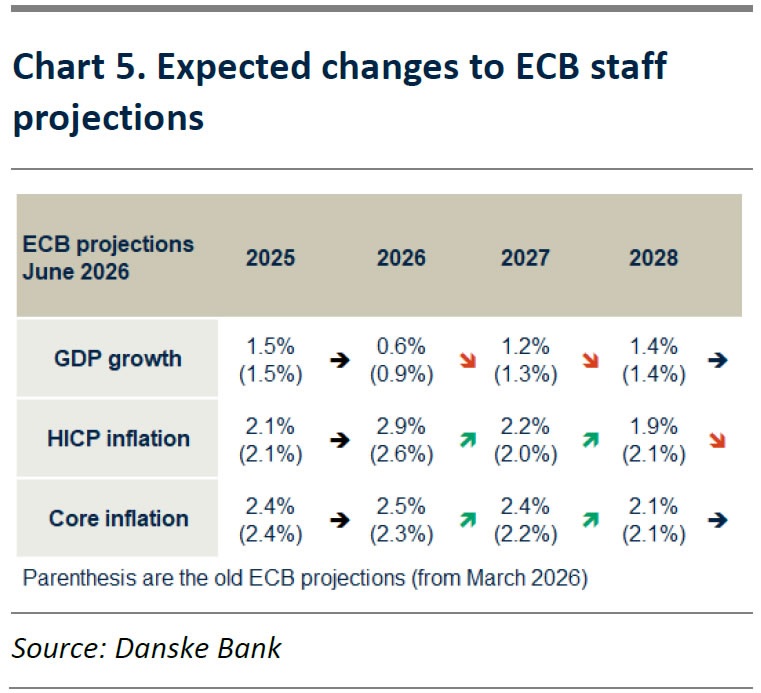
Since the April meeting, headline inflation has evolved broadly as expected by the ECB while core inflation has surprised on the upside due to a strong services reading in May. Oil futures have moved higher compared to the baseline staff projections in March and we thus expect the new staff projections to increase the 2026 inflation forecast to 2.9% y/y (from: 2.6%) and 2027 to 2.2% y/y (from: 2.0%). Growth data has surprised on the downside both in terms of Q1 GDP and survey-based indicators in Q2, so we expect a downward revision of the 2026 GDP growth to 0.6% y/y (from: 0.9% y/y) and 2027 to 1.2% y/y (from: 1.3%). See chart 2 and next page for more details. As the new staff projections likely assume around 68bp worth of hikes in the technical assumptions, we believe they give the GC arguments for hiking twice this year.
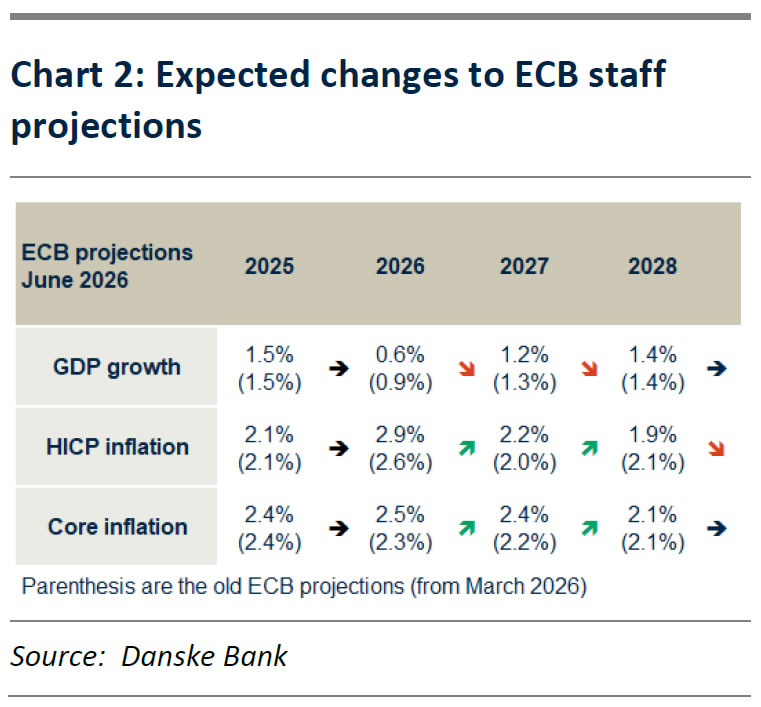
With the June hike fully priced in by markets, all focus during the press conference is on signals. We expect Lagarde to keep full optionality on the future policy rate path, including a potential second summer hike. The well telegraphed policy hike coming next week reveals a preference for curbing upside inflationary risks rather than addressing downside growth risks. As one hike is not significantly changing economic conditions, we expect the ECB to deliver another 25bp hike in Q3. Limited new data will be available by the July meeting, making a firm assessment of potential second round effect difficult, which increases the uncertainty of the exact timing of a potential second hike. We stress that the decision of a hike in July or September does not significantly affect the economic outlook nor our overall view on rates markets where we still favour playing the move for lower short-end swap rates.
New staff projections to show higher inflation and lower growth
The June ECB meeting will feature a new set of staff projections, which will be important for the monetary policy outlook. In this section, we review data since the last meeting and preview what to expect from the new staff projections. There will both be new baseline projections and updated scenarios. Starting with inflation, the March print came in slightly lower than implied by the staff projections while April and May point to Q2 headline inflation broadly as expected in the baseline projections. On the other hand, core inflation has surprised on the upside due to the surprisingly strong services print of 3.5% y/y (0.5% m/m s.a.) in May, which means Q2 core inflation is set to come in higher than both the baseline and the “adverse” scenario.
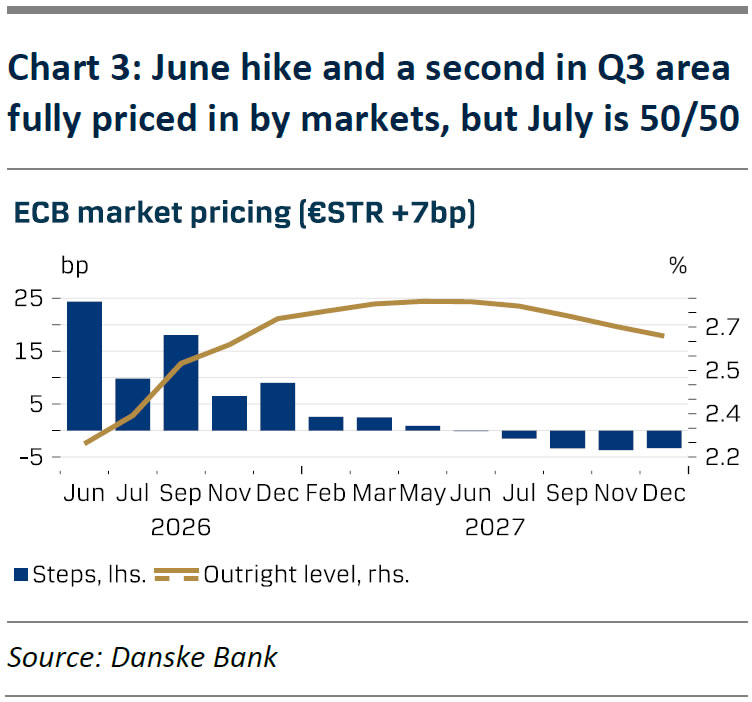
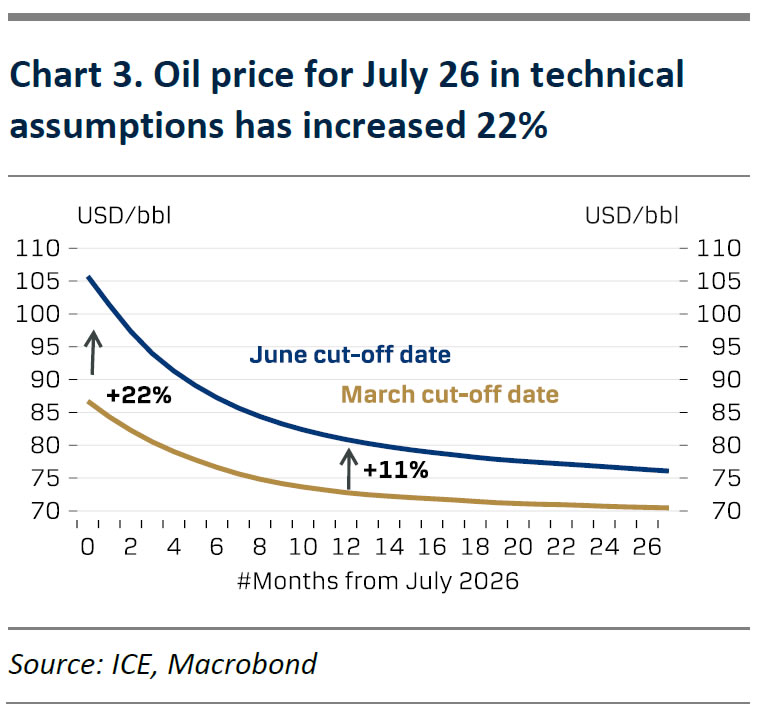
Regarding the inflation outlook, headline is likely to be revised up to 2.9% y/y in 2026 (from 2.6% y/y) and to 2.2% y/y in 2027 (from: 2.0% y/y) as the technical assumptions for the June meeting will feature higher commodity price assumptions for oil amid broadly unchanged gas prices. Specifically for the July 2026 delivery the oil future has risen by 22% from 87 USD/bbl to 106 USD/bbl and the delivery price for July 2027 has risen by 11% (see chart 3). The gas futures are broadly similar to the March cut-off date. With car fuels having a weight of 4% in the HICP index compared to gas at 1.6% we expect the higher oil futures to dominate and thus contribute to higher headline inflation. We expect core inflation to be revised up to 2.5% in 2026 (from: 2.3%) and 2027 to 2.4% (from: 2.2%), which is partly due to the upside surprise in Q2 and due to indirect effects from higher oil prices. Working in the other direction is the fact that wage growth is still clearly on a declining trend according to the ECB wage tracker and as growth in negotiated wages in Q1 was surprisingly low. Hence, we still expect a return to 2.1% y/y 2028 as in the March projections, see chart 5.
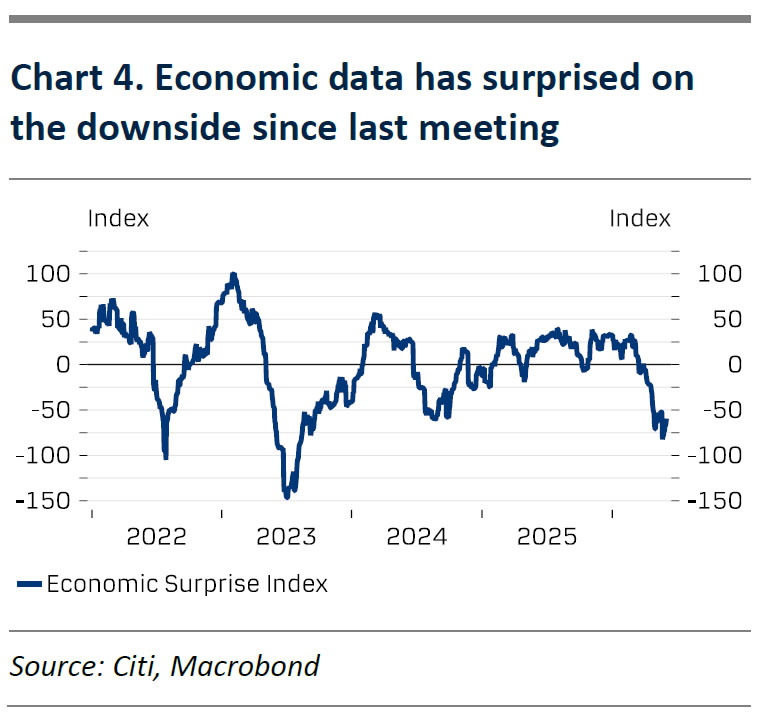
In terms of the growth outlook, we expect a sharp downward revision of 2026 GDP growth to 0.6% y/y (from: 0.9% y/y). We also expect 2027 growth to be revised down to 1.2% y/y (from: 1.3%) while 2028 is expected unchanged at 1.4% y/y. Economic data has surprised on the downside since the March meeting (see chart 4) with particularly the Q1 GDP growth rate at 0.15% q/q. The previous staff projections saw Q1 GDP growth at 0.3% q/q both in the baseline and adverse scenario. The PMI data for April and May was also surprisingly weak, and we thus expect ECB staff to assume quarterly growth of 0.0% q/q in Q2. The economy is thus expected to just remain out of negative growth territory in Q2 and likely to show a small rebound of 0.1% q/q in Q3 in the new projections. The technical assumptions on 3M Euribor will also feature around one extra 25bp hike compared to March projections, which in combination with higher oil price assumptions contribute to the weaker growth outlook in 2026 and a lowering of the 2027 forecast.
With the economy avoiding a recession in the forecast and as the technical assumptions likely assume more than two full hikes (68bp by 2026 YE), we believe the revised staff projections will provide the Governing Council arguments for hiking the policy rate twice by 25bp to bring inflation back to 2.0%.
The Pound: Heading Towards 1.31 or 1.37?
- Conflicting drivers are preventing GBPUSD from finding a clear direction.
- The Bank of England is set to disappoint markets with the scale of its monetary tightening.
The British pound is consolidating against the US dollar amid persistent high geopolitical risks and uncertainty regarding the Bank of England’s monetary policy. The futures market expects the BoE to raise the repo rate by September and again in December. However, the OECD believes that the central bank will turn a blind eye to the highest inflation among G10 countries and keep borrowing costs at 3.75% throughout 2026.
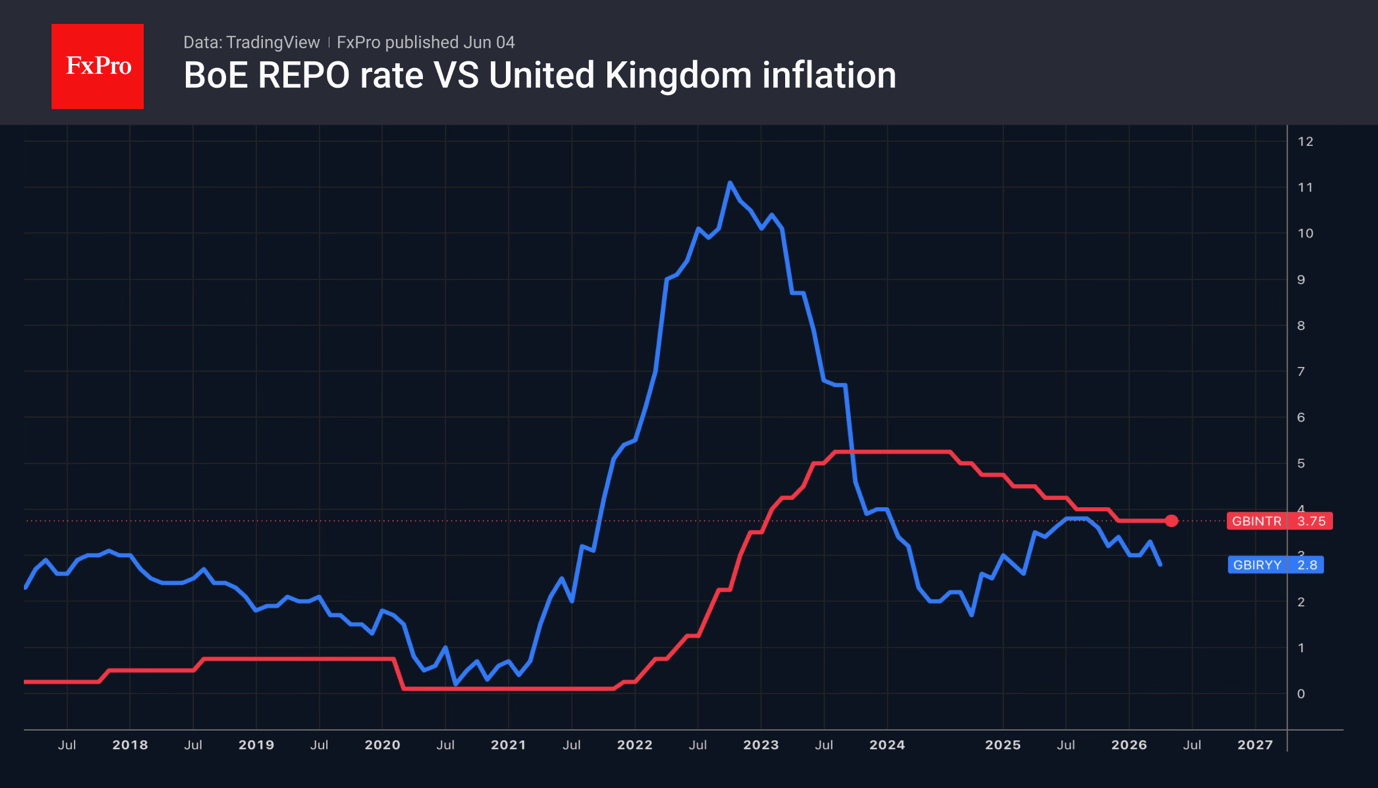
Due to high yields on UK debt, sterling is sensitive to shifts in global risk appetite and to the futures market’s expectations of faster monetary tightening by the Bank of England compared to the Fed. This factor, coupled with five consecutive record highs for the S&P 500, has provided support for GBPUSD. As soon as the broad stock index retreated, the pair plummeted.
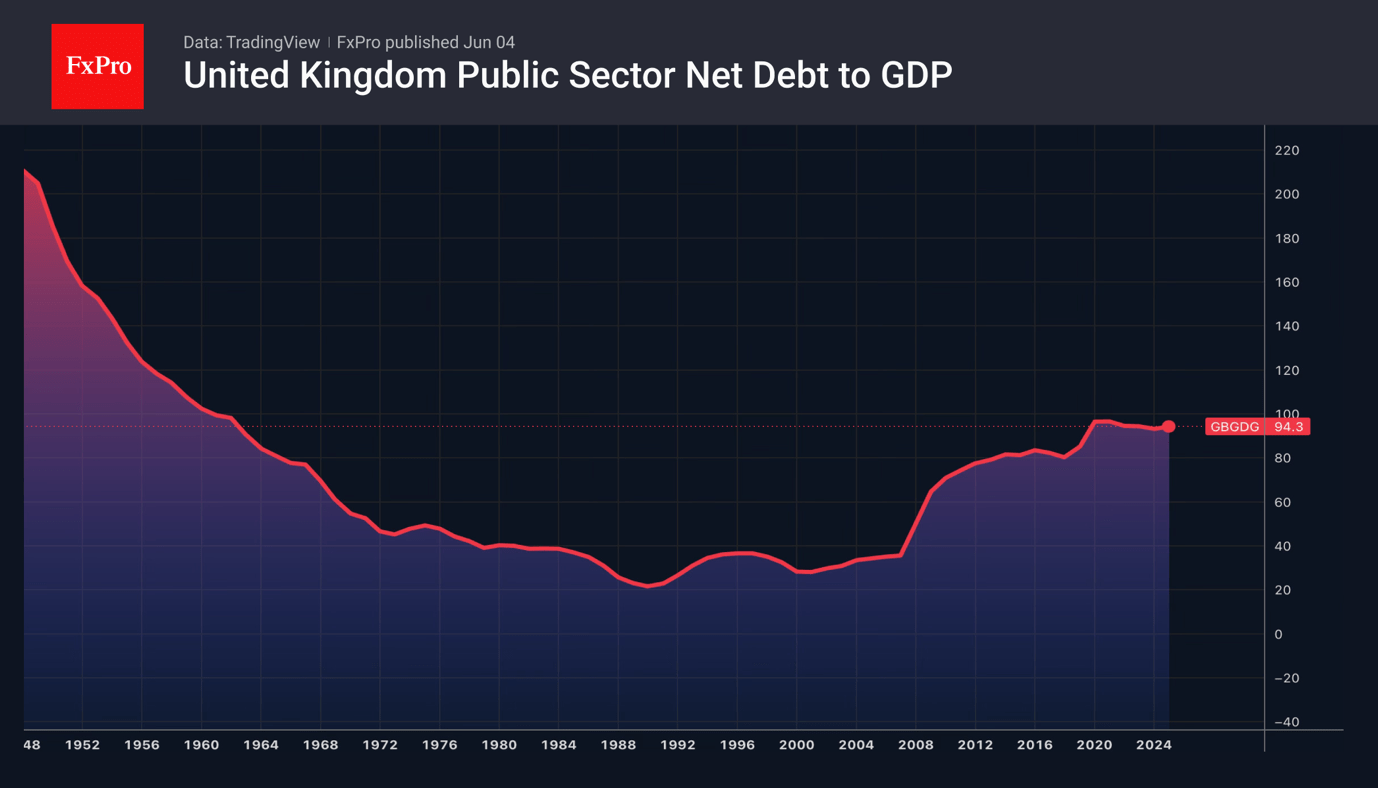
Pressure on the pound is being exerted by the weakness of the UK economy and labour market, as well as the risks of a change of prime minister following Labour’s defeat in the local elections. Investors fear that the new head of government will use fiscal stimulus aggressively, thereby inflating public debt and requiring a new bond issue. The OECD forecasts that the country’s debt will rise from 98.8% of GDP in 2023 to 105.4% in 2027 and recommends that London adhere to the principles of fiscal consolidation.
Thus, a variety of factors are contributing to a medium-term consolidation in GBPUSD. Developments in the Middle East will help the pair determine the direction of its future movement. For now, the White House appears reluctant to significantly escalate military action against Iran unless the situation deteriorates further. If this happens, an escalation of the conflict will boost demand for the US dollar as a safe-haven asset and push the pound towards $1.31.
On the other hand, the conclusion of a deal with Iran, even if its terms are vague and key issues are deferred to a later date, will provide fresh impetus for a rally in US stock indices and an improvement in global risk appetite. GBPUSD will head towards 1.37.
Traders should also factor in a possible surprise from the Fed. According to Morgan Stanley, the first FOMC meeting under Kevin Warsh’s leadership will shock financial markets and lay the foundations for a prolonged downtrend in the US dollar.
Sunset Market Commentary
Markets
Chipmaker Broadcom’s after-market earnings results sapped sentiment to some extent. A weaker-than-expected sales outlook in particular caused some renewed AI valuation concerns. The sector has had a mindboggling rally so perhaps not much was needed for the market to take some chips off the table. European stock markets still eke out a 0.5% gain but diving into the sectors, semiconductors and AI-related sectors (tech hardware, storage) are clearly lagging. Nasdaq on Wall Street opens with losses of around 1% with Broadcom slipping 15%, be it from record highs. The jury’s out whether we’re witnessing the start of a larger and broader correction or not.
The US dollar loses ground with the risk mood outside AI holding on pretty decently for now. EUR/USD rebounded from a sub 1.16 reading yesterday to 1.164 currently, calling off the immediate threat for a downside technical break that may have paved the way for a return all the way to 1.1392. DXY eased from yesterday’s highest closing level since the April 8 ceasefire to 99.23. Even USD/JPY marched lower. The proximity of the 160 barrier is clearly helping. This psychologically important barrier has been a trigger for Japanese officials to intervene before. Markets are wary to push USD/JPY beyond that level, for now at least. The yen also drew some support from a Bloomberg citing “people familiar with the matter” that the Bank of Japan is mulling a June hike with another one possible later in 2026. Money markets currently assume “later” to be December. EUR/GBP recovers marginally for a second day with the pair currently at 0.865 in technically insignificant trading.
Another reason for USD weakness is oil. Brent is trending lower to $94.6 per barrel. This compares to yesterday’s $97.81 and follows a new US-brokered ceasefire between Lebanon and Israel. Americans hope it keeps the peace talks with Iran on track. The Middle East country insists that any deal must include Lebanon too, which is home to the Iran-backed Hezbollah. Ongoing missile fire is testament to the shaky nature of the truce though. Core bonds enjoy it anyway with yields in the US down between 3 and 5 bps in a bull steepening move. German rates ease 1.2-2.5 bps. A June rate hike remains fully priced in. Prior to the ECB’s quiet period, which has kicked in as of today, most officials struck a hawkish tone that steered markets into their current positioning.
News & Views
Swiss inflation stayed subdued in May, according to data published by the Statistical Office (FSO). Consumer prices rose 0.2% M/M and 0.6% Y/Y, slightly softer than expected (was 0.3% M/M and 0.6% Y/Y in April). Prices increases thus stay on the lower side of the SNB 0%-2% price stability target band. Core inflation also printed at a mild 0.1% M/M and 0.3% Y/Y (unchanged from April). FSO said the monthly rise was due to factors including rising housing rentals, higher prices in the hotel sector. Prices for vegetables, petrol, car rental and car sharing also increased. Prices for air transport and heating oil eased, amongst others. Yesterday, SNB President Schlegel indicated that medium term prices pressure essentially stay unchanged. SNB policy is still expansive. However, with current inflation data SNB probably has every room, more than other CB’s, to await the impact on growth and inflation from geopolitical tensions/the supply shock. As such, it can keep a close eye on the FX-component of policy. Looking at prices of imported goods (-0.1%M/ and 0.7% Y/Y), the franc still contributes to containing inflation. This also allows SNB to keep its ‘warning’ on increased willingness to intervene in FX markets if necessary. After strengthening to the EUR/CHF 0.91 area last week, the franc this week eased to currently trade near EUR/CHF 0.918.
Czech May CPI increased by 0.1% M/M and 2.1% Y/Y. The outcome was below expectations. Last month headline inflation was 0.5% M/M and 2.5% Y/Y. Core inflation (ex-energy and un processed food) slowed to 0.1% M/M and 2.3% Y/Y (from 2.9%) in April, with especially processed food prices easing. Energy prices declined 0.3% M/M (to +1.8% Y/Y from 1.5%). Services inflation printed at 0.4% M/M and 4.7% Y/Y (from 4.8%). Goods prices were unchanged on the month and 0.6% Y/Y (from 1.1%). Today’s data at first sight should give Czech National Bank some comfort. The CNB early May left is policy rate unchanged at 3.5%, saying policy needs to be kept relatively tight. At the same time, Q1 labour market data showed very strong nominal and real wage growth at 8.1% Y/Y and 6.4% Y/Y respectively. This is a source of concern for CNB. The 2-y swap yield today eases about 7 bps to 4.24% with money markets pushing back expectations for a hike in the near future. Markets still discount a policy rate near 4% toward the end of the year. The Czech koruna trades little changed in a daily perspective at EUR/CZK 24.20.
Chart Alert: Dow Jones (DJIA) Under Pressure, Medium-Term Uptrend at Risk
Key takeaways
- The Dow Jones Industrial Average is showing increasing signs of relative weakness, underperforming major US equity benchmarks since the March 2026 market recovery and now facing a potential bearish reversal after breaking below a key ascending channel support.
- Renewed US-Iran geopolitical tensions, rising oil prices, and a hawkish repricing of Federal Reserve policy have tightened financial conditions, creating headwinds for cyclical sectors that dominate the Dow Jones.
- A bear-flattening US Treasury yield curve is raising concerns about bank profitability and financial-sector performance, particularly given Financials’ large weighting in the DJIA.
Following up on our earlier structural concerns regarding narrow market breadth and the underlying vulnerabilities of traditional cyclical sectors, on Wednesday, 3 June 2026, price action offered a stark confirmation.
The Dow Jones Industrial Average (DJIA) posted a significant pullback, dropping 1.21% to close at 50,692. Notably, the index opened near its high of 51,220.92 and steadily ground lower throughout the day, closing exactly on the session lows.
So far, since the start of the current medium-term bullish trend on 30 March 2026, the DJIA has remained the underperformer among its peers despite hitting a recent fresh all-time high earlier this week with a gain of just 12.1% versus the S&P 500 (+19.1%), small-cap Russell 2000 (+19.9%), and the tech-heavy Nasdaq 100 (+33.2%) (see. Fig. 1).
Fig. 1: Dow Jones (DJIA) & other major US stock indices performance from 30 Mar 2026 to 3 Jun 2026 (Source: MacroMicro). The information presented is historical information, and past performance is not indicative of future performance.
Geopolitical risks, rising yields, and bear flattening on the yield curve
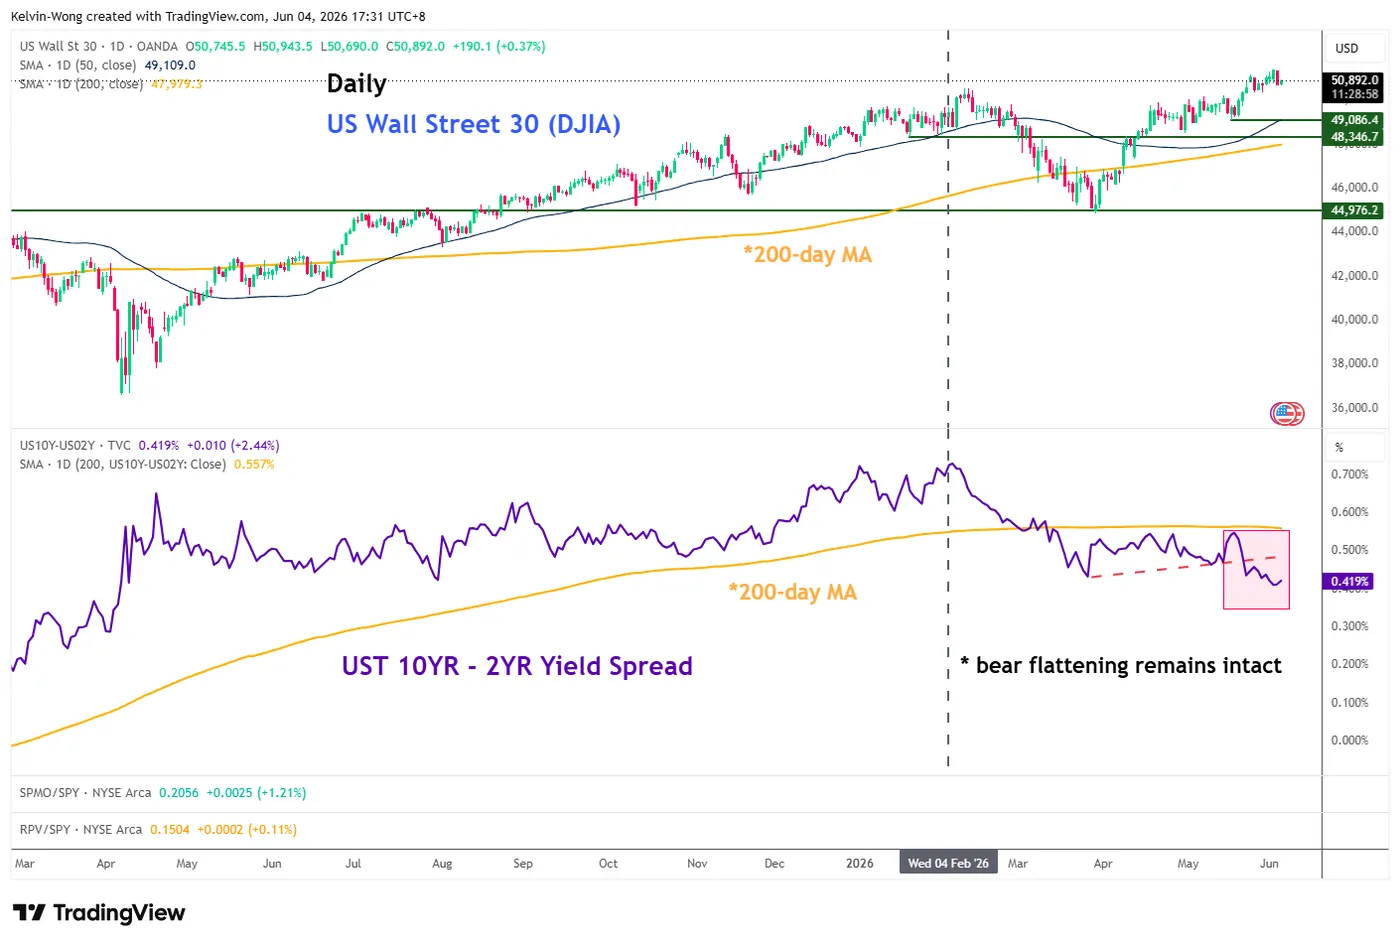
Fig. 2: US Treasury yield curve (10-YR -2-YR) with US Wall Street 30 CFD as of 4 Jun 2026 (Source: TradingView). The information presented is historical information, and past performance is not indicative of future performance.
The primary catalyst for this aggressive risk-off rotation was an escalation in Middle Eastern geopolitics. Fresh threats to the fragile US-Iran ceasefire, alongside reports of launched or attempted retaliatory strikes, sent shockwaves through risk assets.
This geopolitical premium immediately bid up the energy complex, with both WTI and Brent crude jumping by around 2%.
Adding fuel to the fire, the US Treasury market resumed its hawkish repricing. The rising expectations of a more hawkish Fed under new Chair Kevin Warsh have been putting sustained upward pressure on yields.
Yesterday, Treasury yields climbed once again, placing a heavier discount rate on equities and tightening financial conditions further.
In addition, the hawkish repricing has pushed the 2-year US Treasury yield up by 40 basis points since mid-April 2026, outpacing the 10-year yield and resulting in a bear-flattening of the yield curve (see Fig. 2).
Bear flattening typically signals tighter financial conditions, which pressure bank profitability and, in turn, create a negative feedback loop in the DJIA, as the Financials sector carries the largest weight of around 27%.
Let’s now unpack the short-term trajectory (1 to 3 days) of the DJIA from a technical analysis perspective.
Dow Jones (DJIA) – Broke Below Minor Ascending Channel Support
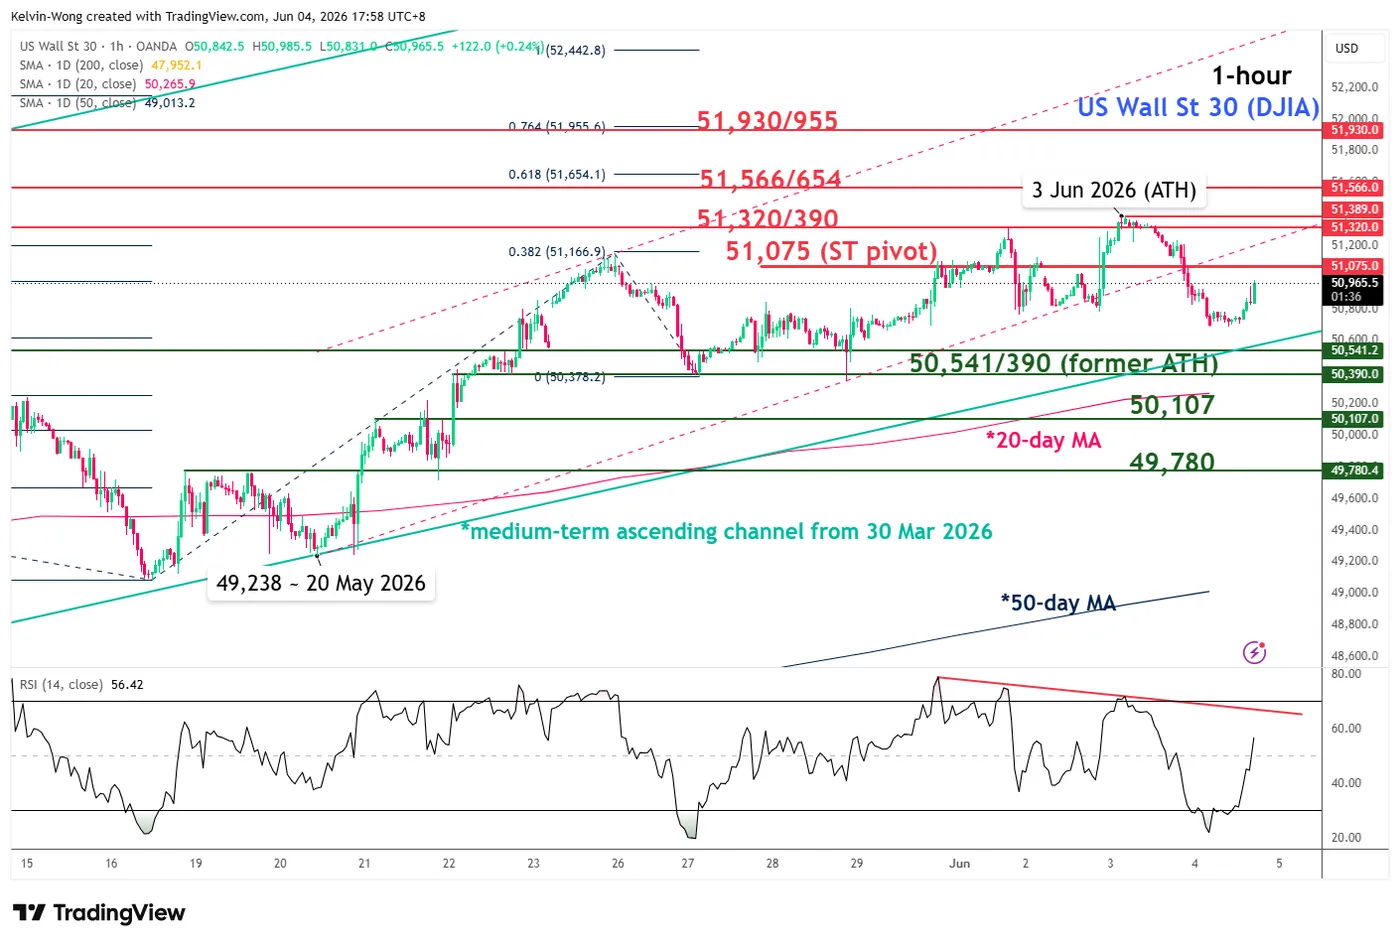
Fig. 3: US Wall Street 30 CFD minor trend as of 4 Jun 2026 (Source: TradingView). The information presented is historical information, and past performance is not indicative of future performance.
Trend bias: Bearish reversal of medium-term uptrend, 51,075 key short-term pivotal resistance (see Fig. 3).
Supports: 50,541/390 (former all-time high area of 10 February 2026), 50,107 (also close to the 20-day moving average), 49,780 (former minor highs of 18 May/19 May 2026).
Next resistances: 51,320/390 (current all-time high area), 51,566/654 (Fibonacci extension cluster), 51,930/955 (Fibonacci extension).
Key Elements to Support the Short-Term Bearish Bias on Dow Jones (DJIA)
- The price action of the US Wall Street 30 CFD has broken below its minor ascending channel support from the 20 May 2026 low, putting the near-term bullish trend in jeopardy.
- The hourly RSI momentum indicator has flashed a bearish divergence signal.
Dollar Falls as Peace Hopes Return, But Risks Haven’t Gone Away
Financial markets traded with a mixed tone today as investors tried to balance fresh signs of diplomatic progress in the Middle East against lingering concerns that the region's energy and security risks are far from resolved. The shift in sentiment was reflected most clearly in currency markets, where Dollar weakened broadly as traders scaled back some of the safe-haven demand that had supported the greenback earlier in the week.
The latest optimism came after US President Donald Trump said in a social media post that he was "in the middle of my final negotiations to end the War with the Islamic Republic of Iran." The comments revived hopes that Washington and Tehran could still reach some form of agreement despite several days of conflicting headlines, military incidents, and reports suggesting talks had stalled.
Supporting the more constructive mood was news of a new US-mediated ceasefire agreement between Israel and Lebanon. Lebanese President Joseph Aoun said the ceasefire could come into force within 24 hours after approval by all concerned parties. While Hezbollah has yet to publicly comment, markets interpreted the development as another sign that diplomatic efforts across the region are continuing rather than collapsing.
Oil prices responded accordingly. Brent crude slipped back below $95 a barrel, reversing part of this week's rebound. The decline suggests traders are once again assigning a higher probability to some form of ceasefire extension or interim agreement rather than an immediate escalation toward a broader regional conflict. Yet the move lower in oil was relatively modest, reflecting continued caution about the underlying situation.
Indeed, few market participants appear willing to fully embrace the peace narrative. The US-Iran negotiations have repeatedly swung between optimism and disappointment over recent months. Traders know that a single headline can quickly reverse sentiment, particularly when key issues surrounding regional security, energy flows, and sanctions remain unresolved. The result is a market that is reducing risk premiums rather than removing them altogether.
There are also growing concerns that even if diplomacy succeeds, the economic damage may already be accumulating. According to a Politico report, energy industry executives have recently warned senior White House officials that global petroleum inventories are being steadily depleted as disruptions linked to the Middle East continue. Refiners are reportedly relying more heavily on storage inventories to replace barrels no longer arriving from the region, raising the prospect of tighter supply conditions later in the summer.
That warning helps explain why oil traders remain cautious despite improving geopolitical headlines. The concern is not limited to whether the Strait of Hormuz remains open. Instead, the market is increasingly focused on how long current supply disruptions can persist before inventory drawdowns begin to create a more visible shortage. In that sense, lower oil prices may reflect improving sentiment today, but not necessarily confidence about the outlook several weeks from now.
Elsewhere, risk appetite was also restrained by weakness in US equity futures. S&P 500 futures pointed lower as Broadcom led semiconductor shares down following a fiscal second-quarter revenue miss. The decline threatens the S&P 500's nine-week winning streak and raises questions about whether the AI-driven equity rally can maintain its momentum.
In currency markets, Dollar was the weakest performer of the day as easing geopolitical concerns reduced safe-haven demand. Canadian Dollar followed as lower oil prices weighed on sentiment, while Yen also underperformed. Swiss Franc led gains, benefiting from the retreat in energy prices and lower global yield pressure, followed by Euro and Sterling. Aussie and Kiwi traded in the middle of the pack as markets searched for clearer direction. For now, markets are willing to price progress on Iran, but they remain unwilling to conclude that the risks have disappeared.
US Initial Jobless Claims Jump to 225K vs Exp. 211k
The US labor market may be losing a little momentum, but it is not showing signs of breaking. Initial jobless claims rose more than expected last week, yet continuing claims remained relatively stable, suggesting layoffs are increasing only gradually. With Friday's payrolls report approaching, markets are still waiting for a definitive signal on employment conditions. Read More.
USD/CAD Surges on New US Tariff Threats. A Break Above 1.40 Could Change Everything.
Oil is rising, but the Canadian Dollar is falling. That's because markets are increasingly worried about a proposed 12.5% US tariff that could bypass Canada's traditional trade protections and hit an economy already struggling with stagnant growth. With USD/CAD approaching the critical 1.40 level, the question is whether this bounce is merely a correction—or the start of a much bigger trend. Read More.
Swiss Inflation Misses Expectations, unchanged at 0.6% in May
Swiss May CPI held at just 0.6%, well below expectations and comfortably within the SNB's target range. The data reinforce the view that Switzerland remains largely insulated from the inflation pressures forcing other policymakers toward a more hawkish stance. Read More.
EUR/CHF and GBP/CHF Gain Breakout Momentum as US-Iran Stalemate Keeps Oil Elevated
Most investors associate geopolitical uncertainty with a stronger Swiss Franc. This time, the opposite may be true. As US-Iran negotiations drag on and oil prices remain elevated, inflation concerns are pushing the ECB and BoE toward tighter policy while Switzerland remains comfortably within its inflation target. The result is a widening policy divergence that may continue to support EUR/CHF and GBP/CHF. Read More.
RBA's Bullock Warns Second-Round Inflation Risks Are Emerging
The RBA believes its rate hikes are finally starting to work. The problem is that a new inflation threat is emerging. Governor Michele Bullock warned that higher fuel costs linked to the Middle East conflict are beginning to spread through the economy, raising concerns that energy-driven inflation could become embedded in a broader range of goods and services. Read More.
EUR/USD Daily Outlook
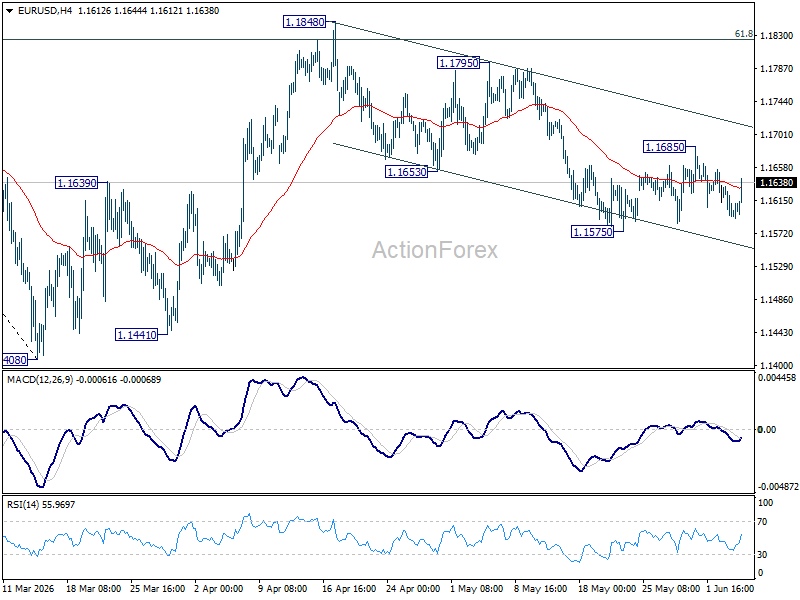
EUR/USD is staying in range above 1.1575 and intraday bias remains neutral. On the downside, break of 1.1575 support will resume the fall from 1.1848 to retest 1.1408 low. Above 1.1865 will target 1.1795 resistance. Firm break there will argue that rise from 1.1408 is ready to resume through 1.1848.
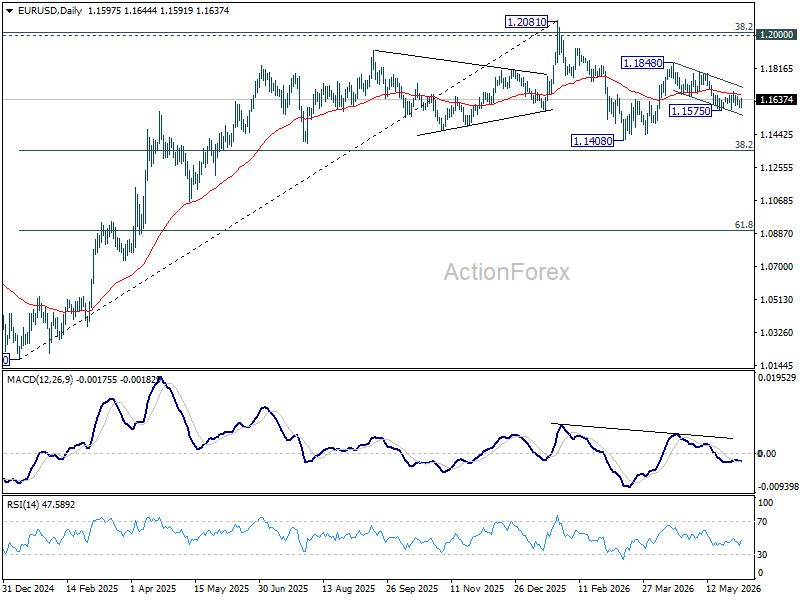
In the bigger picture, the strong support from 38.2% retracement of 1.0176 to 1.2081 at 1.1353 suggests that the pullback from 1.2081 is more likely a corrective move. Strong support was also found in 55 W EMA (now at 1.1542). Focus is back on 1.2 key cluster resistance level. Decisive break there will carry long term bullish implications. Nevertheless, break of 1.1408 support will revive the case of medium term bearish trend reversal.
US Initial Jobless Claims Jump to 225K vs Exp. 211k
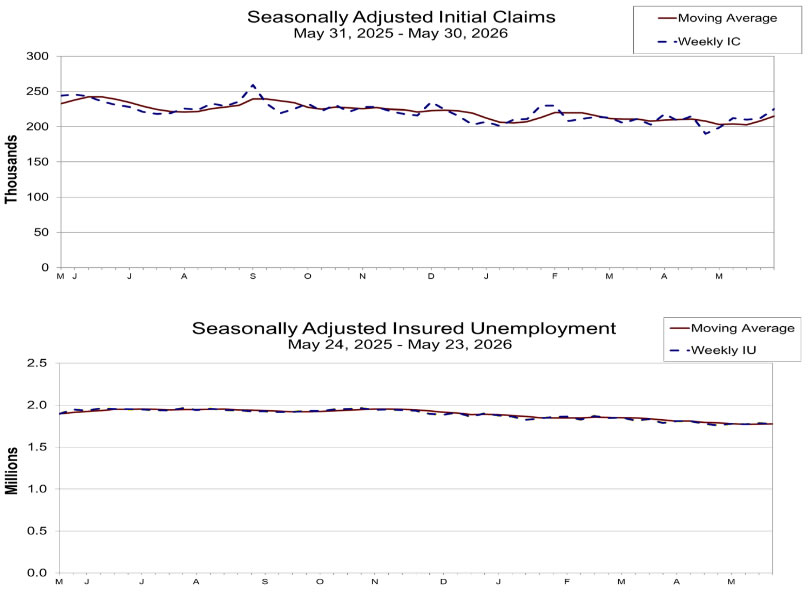
US initial jobless claims rose by 13k to 225k in the week ending May 30, exceeding expectations of 211k and marking a modest softening in labor market conditions ahead of Friday's closely watched non-farm payrolls report. The four-week moving average, which smooths out weekly volatility, increased by 6.5k to 214.75k, suggesting layoffs have edged higher in recent weeks.
However, the broader picture remains far from alarming. Continuing claims fell by -8k to 1.777m in the week ending May 23, indicating that unemployed workers are not finding it significantly more difficult to secure new jobs. While the four-week average of continuing claims ticked up slightly to 1.777m, overall claims levels remain historically consistent with a labor market that is slowing only gradually.
| Indicator | Previous | Latest | Expectation |
|---|---|---|---|
| Initial Jobless Claims | 212k | 225k | 211k |
| Four-Week Avg. Initial Claims | 208.25k | 214.75k | — |
| Continuing Claims | 1.785m | 1.777m | — |
| Four-Week Avg. Continuing Claims | 1.772m | 1.777m | — |
EUR/USD Daily Outlook
EUR/USD is staying in range above 1.1575 and intraday bias remains neutral. On the downside, break of 1.1575 support will resume the fall from 1.1848 to retest 1.1408 low. Above 1.1865 will target 1.1795 resistance. Firm break there will argue that rise from 1.1408 is ready to resume through 1.1848.
In the bigger picture, the strong support from 38.2% retracement of 1.0176 to 1.2081 at 1.1353 suggests that the pullback from 1.2081 is more likely a corrective move. Strong support was also found in 55 W EMA (now at 1.1542). Focus is back on 1.2 key cluster resistance level. Decisive break there will carry long term bullish implications. Nevertheless, break of 1.1408 support will revive the case of medium term bearish trend reversal.