Sample Category Title
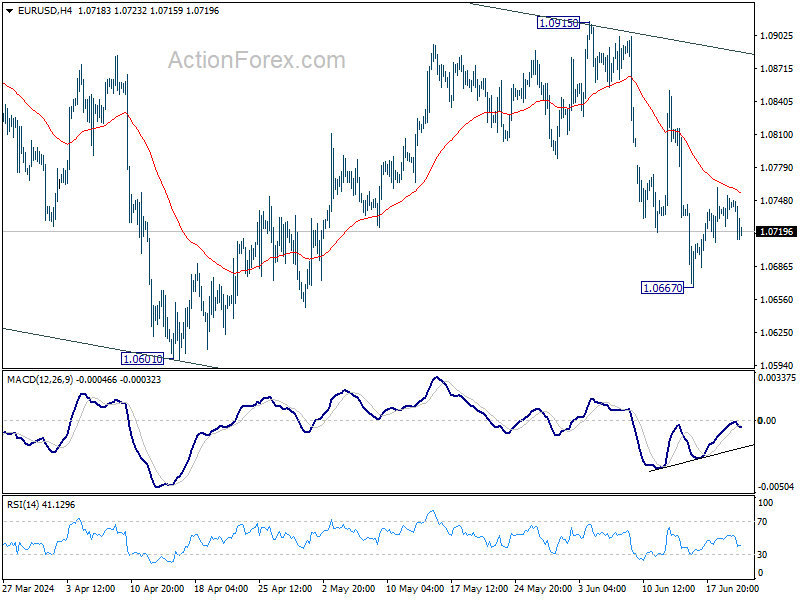
EUR/USD Mid-Day Outlook
Daily Pivots: (S1) 1.0728; (P) 1.0741; (R1) 1.0756; More....
Intraday bias in EUR/USD remains neutral and outlook is unchanged. Further decline is expected as long as 55 4H EMA (now at 1.0756) holds. Fall from 1.0915 is seen as another leg in the larger corrective pattern. Below 1.0677 will target 1.0601 low first. Firm break there will target channel support at 1.0500 next. Nevertheless, sustained break of 55 4H EMA will turn bias to the upside for stronger rebound instead.
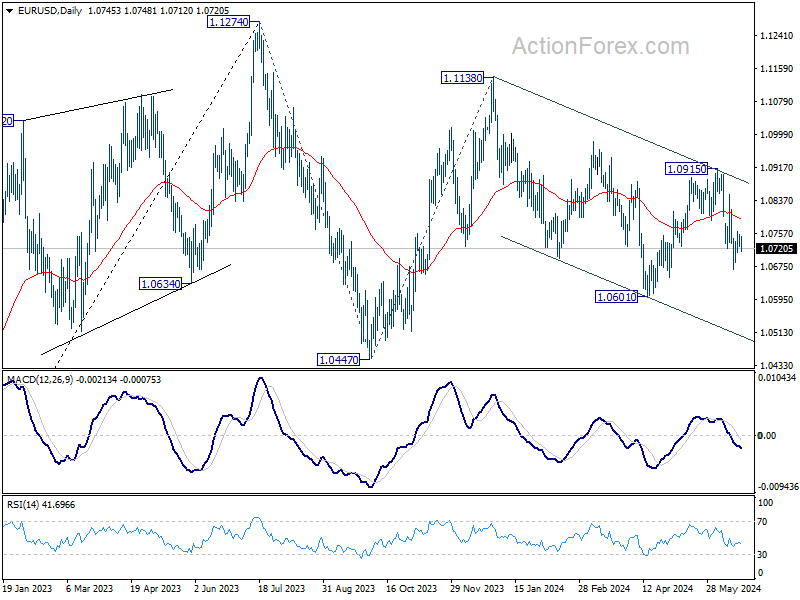
In the bigger picture, price actions from 1.1274 are viewed as a corrective pattern that's still in progress. Break of 1.0601 will target 1.0447 support and possibly further to 100% projection of 1.1274 to 1.0447 from 1.1138 at 1.0311. For now, this will remain the favored case as long as 1.0915 resistance holds, in case of rebound.
USD/CHF Mid-Day Outlook
Daily Pivots: (S1) 0.8835; (P) 0.8845; (R1) 0.8856; More….
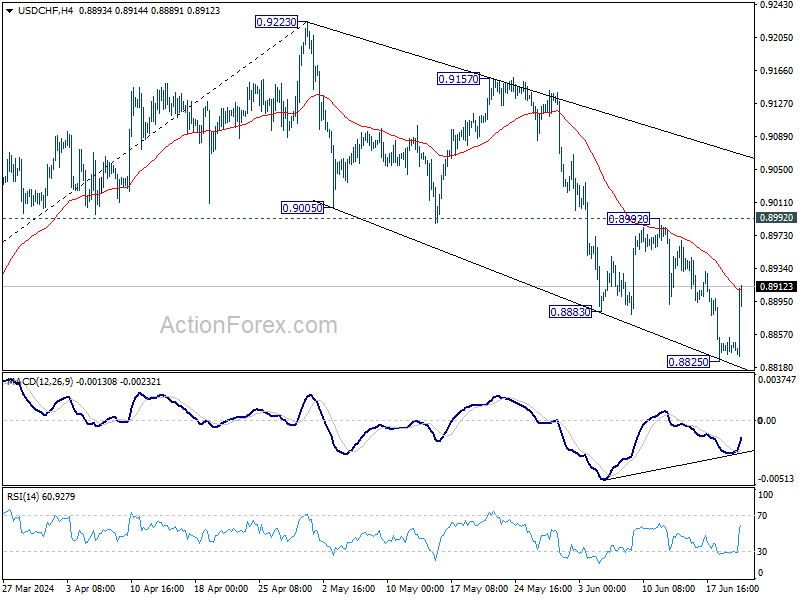
Intraday bias in USD/CHF is turned neutral first with current recovery. Some consolidations would be seen but outlook will stay bearish as long as 0.8992 resistance holds. On the downside, break of 0.8825 will resume the fall from 0.9223. Next target is 61.8% retracement of 0.8332 to 0.9223 at 0.8672.
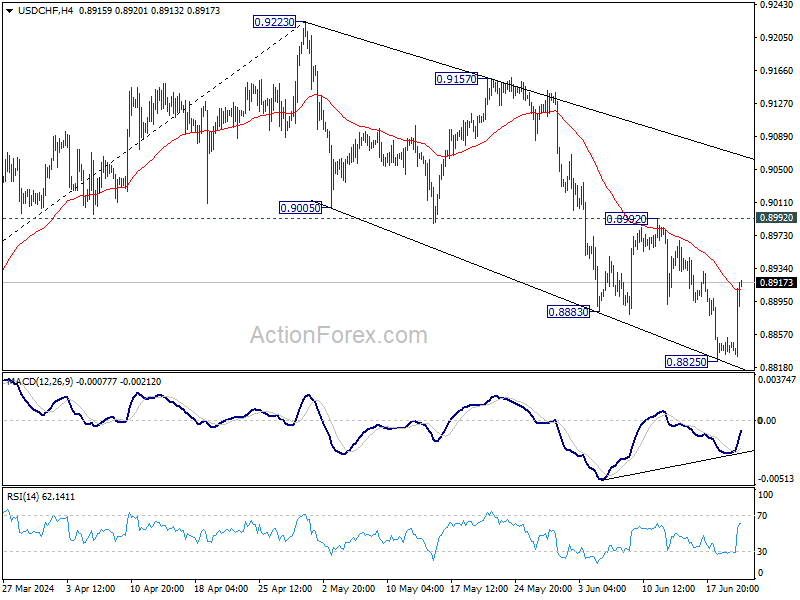
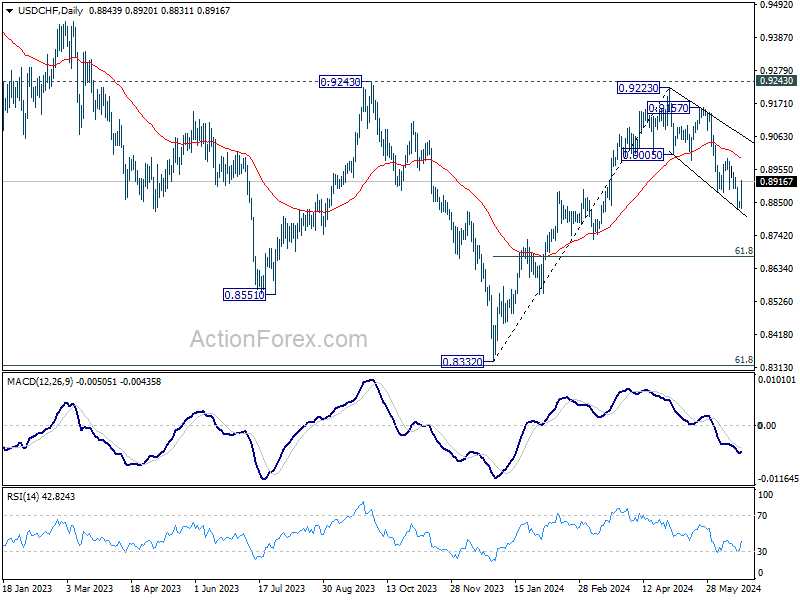
In the bigger picture, price actions from 0.8332 medium term bottom are seen as developing into a corrective pattern to the down trend from 1.0146 (2022 high). Rejection by 0.9243 resistance affirms this case, and maintains medium term bearishness. While more range trading could be seen between 0.8332/0.9243 first, downside break out is mildly in favor at a later stage.
GBP/USD Mid-Day Outlook
Daily Pivots: (S1) 1.2695; (P) 1.2717; (R1) 1.2742; More...
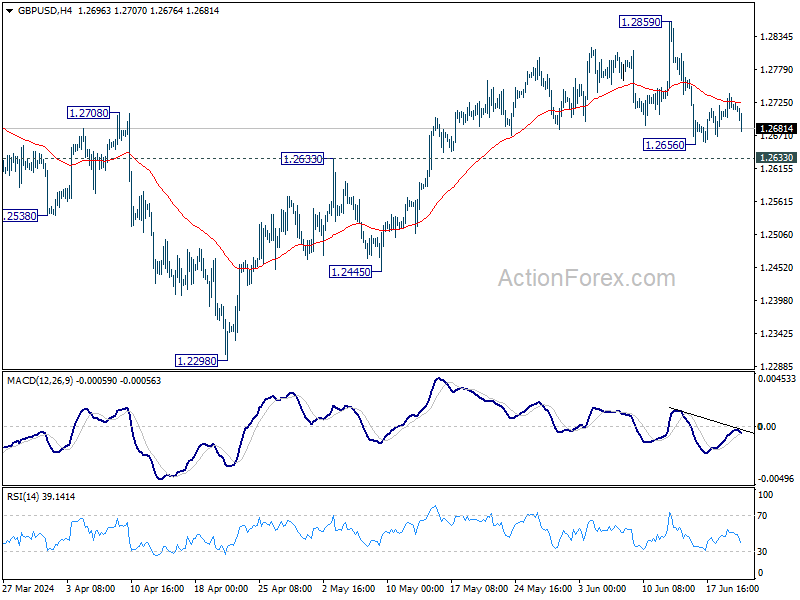
GBP/USD weakens after rejection by 55 4H EMA but stays above 1.2656 temporary low. Intraday bias remains neutral first. While another recovery cannot be ruled out, risk will stay on the downside as long as 1.2859 resistance holds. Firm break of 1.2633 resistance turned support will argue that whole rise from 1.2298 has completed, and target 1.2445 and below.

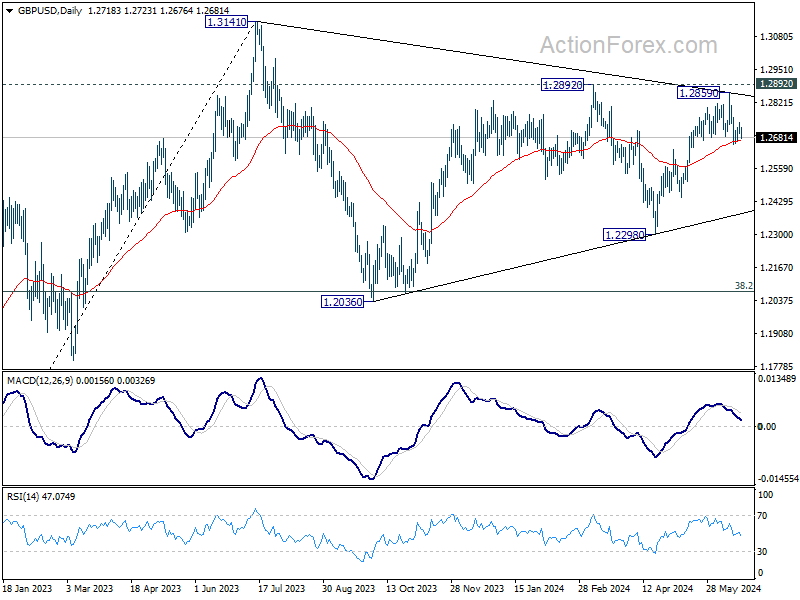
In the bigger picture, price actions from 1.3141 medium term top are seen as a corrective pattern. Fall from 1.2892 is seen as the third leg which might have completed already. Break of 1.2892 resistance will argue that larger up trend from 1.0351(2022 low) is ready to resume through 1.3141. Meanwhile, break of 1.2445 support will extend the corrective pattern with another decline instead.

Swiss Franc Plummets After SNB Rate Cut, Sterling Weakens Following BoE Hold
Swiss Franc is currently the worst performer today, plummeting after SNB delivered a rate cut for the second consecutive meeting. In addition to the rate reduction, SNB lowered its inflation forecast across the board. Nevertheless, Franc's selloff has been relatively restrained.
Notably, SNB did not mention the recent sharp appreciation of the Franc in its press release, suggesting that it wasn't a primary driver for the rate cut. Additionally, SNB Chair Thomas Jordan emphasized that currency market interventions could be executed in both directions. This suggests that SNB might tolerate further appreciation of the Franc for now, especially if driven by political instability in the EU.
Sterling also saw broad weakening, becoming the second worst performer after BoE decided to keep interest rates unchanged, as widely expected. While the decision itself was anticipated, the accompanying statement pointed to the August economic forecasts for a more comprehensive assessment of inflation.
Within the Monetary Policy Committee, some members expressed concern over the persistent high services inflation and its implications for overall inflation persistence. However, other members believed that this did not significantly alter the economy's current disinflationary path. All in all, the statement suggested that a rate cut in August is still on the table.
In the broader currency markets, Australian Dollar, New Zealand Dollar, Dollar have been rotating as the strongest currencies, primarily benefiting from the selloff in European majors. Euro is currently the third weakest currency, as dragged down by the selloff in Swiss Franc and Sterling. Meanwhile, Japanese Yen, despite breaking lower against Dollar, is trading in the middle along with Canadian Dollar.
Technically, a temporary low was formed at 0.8825 in USD/CHF with today's recovery. Some consolidations would be seen first, but outlook will stay bearish as long as 0.8992 resistance holds. Break of 0.8825 is extended later to resume whole decline from 0.9223. However, considering bullish convergence condition in 4H MACD, firm break of 0.8992 will argue that the fall from 0.9223 has completed as a corrective move. Further rally would then be seen back to retest 0.9223 high.
In Europe, at the time of writing, FTSE is up 0.31%. DAX is up 0.41%. CAC is up 0.78%. UK 10-year yield is down -0.0017 at 4.067. Germany 10-year yield is up 0.034 at 2.442. Earlier in Asia, Nikkei rose 0.16%. Hong Kong HSI fell -0.52%. China Shanghai SSE fell -0.42%. Singapore Strait Times fell -0.12%. Japan 10-year JGB yield rose 0.0199 to 0.956.
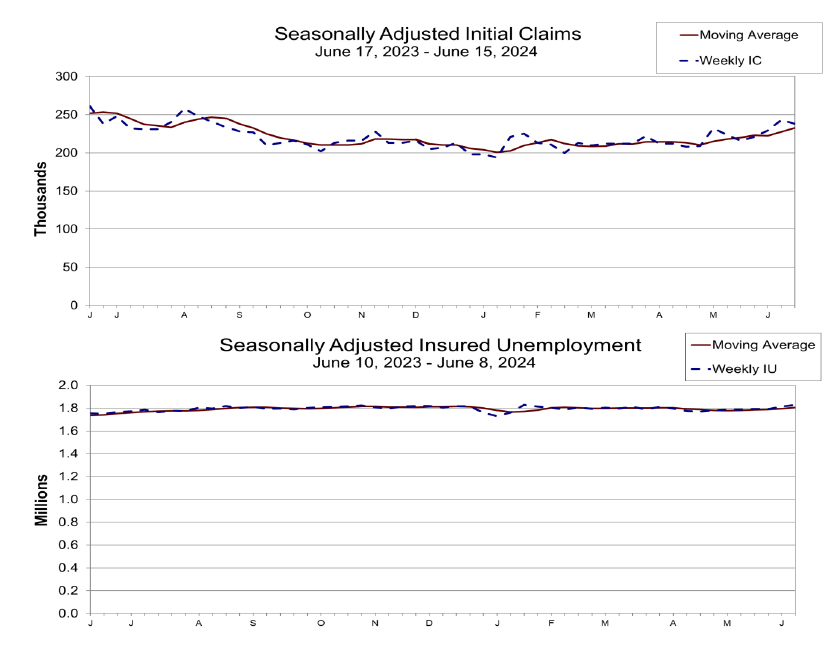
US initial jobless claims falls to 238k vs exp 240k
US initial jobless claims fell -5k to 238k in the week ending June 15, slightly lower than expectation of 240k. Four-week moving average of initial claims rose 5.5k to 233k.
Continuing claims rose 15k to 1828k in the week ending June 8. Four-week moving average of continuing claims rose 10k to 1806k.
BoE maintains rate, eyes August forecasts for inflation assessment
BoE left Bank Rate unchanged at 5.25%, as widely anticipated, with a 7-2 vote among the Monetary Policy Committee members. Swati Dhingra and Dave Ramsden again voted for a 25 bos cut to 5.00%.
The central bank stated that, as part of the August forecast round, the Committee will review all available information to assess whether the risks from persistent inflation are receding. Based on this assessment, the Committee will determine how long the Bank Rate should be maintained at its current level.
While CPI fell to 2% in May, BoE expects it to "rise slightly" in the second half of the year due to the base effects from last year's energy price declines. Additionally, BoE noted that services inflation at 5.7% was "somewhat higher" than projected in the May monetary policy report.
On the growth front, GDP appears to have "grown more strongly than expected" during the first half of the year but remains consistent with a growth rate of around 0.25% per quarter.
SNB cuts 25bps, lowers inflation forecasts slightly
SNB lowered the policy rate by 25bps to 1.25% and maintained the willingness to be active in the foreign exchange markets as necessary.
In the accompanying statement, SNB said "underlying inflationary pressure has decreased again". The central will continue to monitor the development of inflation closely, and will "adjust its monetary policy if necessary.
Taking into account today's policy rate cut, the new conditional inflation forecast were lowered slightly to 1.3% in 2024 (prior 1.4%), 1.1% in 2025 (prior 1.2%), and then 1.0% in 2026 (prior 1.1%).
Growth is likely to remain "moderate" in Switzerland in the coming quarters. SNB anticipates GDP growth of around 1% this year, and 1.5% in 2025.
Ifo upgrades German GDP forecasts, slowly working its way out of crisis
The Ifo Institute upgraded its growth forecasts for German economy, indicating that it is "slowly working its way out of the crisis." GDP is now expected to grow by 0.4% in 2024, up from March forecast of 0.2%. Growth is projected to further accelerate to 1.5% in 2025, maintaining the previous forecast. Inflation is expected to decrease significantly, from 5.9% in 2023 to 2.2% in 2024, and further down to 1.7% in 2025.
The institute anticipates that the overall economic recovery will gain momentum throughout the rest of the year as consumer spending normalizes. Purchasing power of private households is expected to strengthen, leading to a gradual recovery in the demand for goods and services.
Moreover, the Ifo Institute expects ECB's interest rate cut in June is likely to be followed by two more cuts this year. These lower interest rates, coupled with a stable labor market and robust income growth, are expected to boost the consumer economy and aid in the gradual recovery of the construction sector.
New Zealand GDP grows 0.2% qoq, pulls out of recession despite per capita decline
New Zealand's GDP grew by 0.2% qoq in Q1, surpassing the expected 0.1% growth and pulling the economy out of a technical recession following consecutive declines in the last half of 2023. On an annual basis, GDP growth was also 0.2% yoy. The primary industries experienced a modest growth of 0.2% qoq, while goods-producing industries contracted by -1.3% qoq, and services industries saw a slight decline of -0.1% qoq.
Despite the overall GDP growth, GDP per capita fell by -0.3% qoq, marking the sixth consecutive quarterly decline, with an annual decrease of -2.4% yoy. This indicates that while the economy as a whole is recovering, the average economic output per person continues to decline.
"There were a range of results at industry level, with 8 of the 16 industries rising this quarter," noted Ruvani Ratnayake, senior manager of national accounts industry and production. This mixed performance across different sectors highlights the uneven nature of the economic recovery.
GBP/USD Mid-Day Outlook
Daily Pivots: (S1) 1.2695; (P) 1.2717; (R1) 1.2742; More...
GBP/USD weakens after rejection by 55 4H EMA but stays above 1.2656 temporary low. Intraday bias remains neutral first. While another recovery cannot be ruled out, risk will stay on the downside as long as 1.2859 resistance holds. Firm break of 1.2633 resistance turned support will argue that whole rise from 1.2298 has completed, and target 1.2445 and below.
In the bigger picture, price actions from 1.3141 medium term top are seen as a corrective pattern. Fall from 1.2892 is seen as the third leg which might have completed already. Break of 1.2892 resistance will argue that larger up trend from 1.0351(2022 low) is ready to resume through 1.3141. Meanwhile, break of 1.2445 support will extend the corrective pattern with another decline instead.
Economic Indicators Update
| GMT | Ccy | Events | Actual | Forecast | Previous | Revised |
|---|---|---|---|---|---|---|
| 22:45 | NZD | GDP Q/Q Q1 | 0.20% | 0.10% | -0.10% | |
| 01:15 | CNY | 1-y Loan Prime Rate | 3.45% | 3.45% | 3.45% | |
| 01:15 | CNY | 5-y Loan Prime Rate | 3.95% | 3.95% | 3.95% | |
| 06:00 | CHF | Trade Balance (CHF) May | 5.81B | 3.84B | 4.32B | 4.34B |
| 06:00 | EUR | Germany PPI M/M May | 0.00% | 0.10% | 0.20% | |
| 06:00 | EUR | Germany PPI Y/Y May | -2.20% | -2.00% | -3.30% | |
| 07:30 | CHF | SNB Interest Rate Decision | 1.25% | 1.50% | 1.50% | |
| 08:00 | CHF | SNB Press Conference | ||||
| 08:00 | EUR | ECB Economic Bulletin | ||||
| 11:00 | GBP | BoE Interest Rate Decision | 5.25% | 5.25% | 5.25% | |
| 11:00 | GBP | MPC Official Bank Rate Votes | 0--2--7 | 0--2--7 | 0--2--7 | |
| 12:30 | CAD | New Housing Price Index M/M May | 0.20% | 0.20% | 0.20% | |
| 12:30 | USD | Building Permits May | 1.39M | 1.46M | 1.44M | |
| 12:30 | USD | Housing Starts May | 1.28M | 1.38M | 1.36M | |
| 12:30 | USD | Current Account (USD) Q1 | -238B | -206B | -195B | |
| 12:30 | USD | Initial Jobless Claims (Jun 14) | 238K | 240K | 242K | 243K |
| 12:30 | USD | Philadelphia Fed Survey Jun | 1.3 | 4.5 | 4.5 | |
| 14:00 | EUR | Eurozone Consumer Confidence Jun P | -14 | -14 | ||
| 15:00 | USD | Crude Oil Inventories | -2.8M | 3.7M |
US initial jobless claims falls to 238k vs exp 240k
US initial jobless claims fell -5k to 238k in the week ending June 15, slightly lower than expectation of 240k. Four-week moving average of initial claims rose 5.5k to 233k.
Continuing claims rose 15k to 1828k in the week ending June 8. Four-week moving average of continuing claims rose 10k to 1806k.
BoE maintains rate, eyes August forecasts for inflation assessment
BoE left Bank Rate unchanged at 5.25%, as widely anticipated, with a 7-2 vote among the Monetary Policy Committee members. Swati Dhingra and Dave Ramsden again voted for a 25 bos cut to 5.00%.
The central bank stated that, as part of the August forecast round, the Committee will review all available information to assess whether the risks from persistent inflation are receding. Based on this assessment, the Committee will determine how long the Bank Rate should be maintained at its current level.
While CPI fell to 2% in May, BoE expects it to "rise slightly" in the second half of the year due to the base effects from last year's energy price declines. Additionally, BoE noted that services inflation at 5.7% was "somewhat higher" than projected in the May monetary policy report.
On the growth front, GDP appears to have "grown more strongly than expected" during the first half of the year but remains consistent with a growth rate of around 0.25% per quarter.
(BOE) Bank rate maintained at 5.25%
Monetary Policy Summary, June 2024
The Bank of England's Monetary Policy Committee (MPC) sets monetary policy to meet the 2% inflation target, and in a way that helps to sustain growth and employment. At its meeting ending on 19 June 2024, the MPC voted by a majority of 7–2 to maintain Bank Rate at 5.25%. Two members preferred to reduce Bank Rate by 0.25 percentage points, to 5%.
Twelve-month CPI inflation fell to 2.0% in May from 3.2% in March, close to the May Monetary Policy Report projection. Indicators of short-term inflation expectations have also continued to moderate, particularly for households. CPI inflation is expected to rise slightly in the second half of this year, as declines in energy prices last year fall out of the annual comparison.
UK GDP appears to have grown more strongly than expected during the first half of this year. Business surveys, however, remain consistent with a slower pace of underlying growth, of around ¼% per quarter.
The considerable uncertainty around estimates derived from the ONS Labour Force Survey means that it is very difficult to gauge the evolution of labour market activity. Based on a broad set of indicators, the MPC judges that the labour market continues to loosen but that it remains relatively tight by historical standards.
The collective steer from a range of indicators of aggregate pay growth has continued to ease in the latest data. Services consumer price inflation was 5.7% in May, down from 6.0% in March, but somewhat higher than projected in the May Report. This strength in part reflected prices that are index-linked or regulated, which are typically changed only annually, and volatile components.
The MPC's remit is clear that the inflation target applies at all times, reflecting the primacy of price stability in the UK monetary policy framework. The framework recognises that there will be occasions when inflation will depart from the target as a result of shocks and disturbances. Monetary policy will ensure that CPI inflation returns to the 2% target sustainably in the medium term.
At this meeting, the Committee voted to maintain Bank Rate at 5.25%. Headline CPI inflation has fallen back to the 2% target. The restrictive stance of monetary policy is weighing on activity in the real economy, is leading to a looser labour market and is bearing down on inflationary pressures. Key indicators of inflation persistence have continued to moderate, although they remain elevated.
Monetary policy will need to remain restrictive for sufficiently long to return inflation to the 2% target sustainably in the medium term in line with the MPC's remit. The Committee has judged since last autumn that monetary policy needs to be restrictive for an extended period of time until the risk of inflation becoming embedded above the 2% target dissipates.
The MPC remains prepared to adjust monetary policy as warranted by economic data to return inflation to the 2% target sustainably. It will therefore continue to monitor closely indications of persistent inflationary pressures and resilience in the economy as a whole, including a range of measures of the underlying tightness of labour market conditions, wage growth and services price inflation. As part of the August forecast round, members of the Committee will consider all of the information available and how this affects the assessment that the risks from inflation persistence are receding. On that basis, the Committee will keep under review for how long Bank Rate should be maintained at its current level.
Minutes of the Monetary Policy Committee meeting ending on 19 June 2024
1: Before turning to its immediate policy decision, the Committee discussed: the international economy; monetary and financial conditions; demand and output; and supply, costs and prices.
The international economy
2: UK-weighted global GDP was estimated to have risen by 0.5% in 2024 Q1, in line with the projection in the May Monetary Policy Report. It was expected to continue to grow at a similar pace in Q2. Growth rates across advanced economies had converged as US growth had moderated.
3: Euro-area GDP had risen by 0.3% in 2024 Q1. The composite output PMI had reached a 12-month high in May, accounted for in part by the manufacturing sector. US GDP had also expanded by 0.3% in Q1. Growth in both regions was expected to continue at around this pace in Q2.
4: In China, GDP had grown by 1.6% in 2024 Q1, accounted for in part by strength in exports. In other emerging market economies, indicators of activity such as PMIs had seen healthy growth over this period, with particular strength in India.
5: Since the MPC's May meeting, the Brent spot oil price had risen by 3% to around $85 per barrel. European wholesale natural gas spot prices had increased by 12%, with a smaller increase in futures prices.
6: Global shipping costs had risen since the MPC's May meeting amid longer-than-expected disruptions to routes through the Red Sea, although these costs had remained well below their pandemic-era peak levels. In anticipation of constrained shipping capacity over the second half of the year, there were indications that producers were filling inventories sooner than usual. This higher demand combined with ongoing shipping capacity constraints had been pushing up on shipping rates, although there was uncertainty around the extent and timing of any potential effects on consumer prices.
7: Labour markets in advanced economies had remained tight overall. The US unemployment rate had increased to 4.0% in May and the vacancy rate had decreased in April, taking the vacancies-to-unemployment ratio closer to pre-Covid levels. However, non-farm payrolls growth had rebounded in May by more than had been expected by market participants, suggesting continued strength in the labour market. The euro-area unemployment rate had fallen to an historically low level of 6.4% in April. Wage pressures had remained elevated in both regions in 2024 Q1, with the wage growth component of the US employment cost index having ticked up slightly and negotiated wage growth rising to 4.7% in the euro area due to one-off payments. The Committee discussed the extent to which this wage strength could continue to push up on inflationary pressures in those regions.
8: Headline consumer price inflation in major advanced economies had continued to be somewhat above central banks' targets over recent months, with services inflation remaining elevated. In the euro area, twelve-month HICP inflation had been 2.6% in May, while core inflation had risen to 2.9%, slightly higher than expected by market participants. Within this, services inflation had increased particularly strongly, in part due to base effects from German transport prices. US CPI inflation had fallen marginally to 3.3% in May, while core CPI inflation had fallen to 3.4%, both slightly below market expectations. Looking ahead, headline inflation was expected to continue to moderate in both economies, though to remain above inflation targets in 2024. Core services and shelter inflation were expected to decline at a slow pace in the United States, while energy-related base effects could lead to an uneven inflation profile in the euro area.
Monetary and financial conditions
9: As in recent months, major advanced economy government bond yields had seen a relatively high degree of co-movement since the Committee's previous meeting. Within that period, yields had moved in offsetting directions in response to macroeconomic data, in particular in the United States where the news from various indicators had been mixed. More recently, yields had been affected by uncertainty related to the forthcoming French election. Market-implied paths for policy rates across major advanced economies had generally ended the period somewhat lower than at the time of the Committee's previous meeting, except for in the very near term. The sterling effective exchange rate had ended the period around 2% stronger. There had been greater divergence in risky asset prices across countries, where equity prices in Europe had fallen in response to political uncertainty, but those in the United States had increased somewhat.
10: At its meeting ending on 6 June, the ECB Governing Council had decreased its key policy rates by 25 basis points, in line with market expectations. In its statement, the Governing Council had noted that, despite the progress over recent quarters, domestic price pressures had remained strong, and had reiterated that it would follow a data-dependent and meeting-by-meeting approach. Following the announcement, the market-implied path for subsequent cuts in euro-area policy rates in 2024 had fallen from 66 to 44 basis points. At its meeting ending on 12 June, the Federal Open Market Committee (FOMC) had left the federal funds rate unchanged, also in line with market expectations. The median FOMC member now expected that there would be one 25 basis point reduction in the federal funds rate in 2024, compared to three at the time of the March FOMC projections.
11: In the United Kingdom, Bank Rate expectations implied by market pricing had increased following the April CPI release, which had shown inflation higher than expected by both the MPC and market participants. All respondents to the Bank's latest Market Participants Survey (MaPS) expected Bank Rate to be left unchanged at this MPC meeting. MaPS respondents had all continued to expect the next move in Bank Rate to be downward, and the median profile had implied a cumulative 50 basis points reduction in Bank Rate this year, starting in August, although this was down from 75 basis points in the May MaPS. This contrasted somewhat with the path implied by market pricing, which had suggested that the first full 25 basis point cut would occur in November.
12: Medium-term inflation compensation measures in the United Kingdom had been little changed since the MPC's previous meeting.
13: Regarding credit conditions, the 12-month growth rate of aggregate sterling net lending by banks had picked up slightly to 1.0% in April. Annual growth in net secured lending to households had picked up to a recent high, although it had remained well below rates seen before the start of the Bank Rate tightening cycle. Mortgage approvals on house purchases, an indicator of an earlier stage in the house-buying process, had fallen slightly in April after six months of consecutive increases. Quoted rates on fixed-rate mortgage products had been little changed since the MPC's previous meeting.
14: The annual growth rate of aggregate sterling broad money had increased slightly to 0.4% in April. Within that, annual growth in household deposits had picked up further, reflecting a large inflow to ISAs in the most recent month.
Demand and output
15: UK real GDP had increased by 0.6% in 2024 Q1, 0.2 percentage points stronger than had been expected in the May Monetary Policy Report. Just under half of that upside news had been accounted for by stronger government services output, which had tended to be volatile and subject to significant revision over recent quarters. Market sector output growth had also been somewhat stronger than expected, however.
16: Monthly GDP had been unchanged on the month in April, somewhat stronger than Bank staff expectations, which had been for a greater unwinding of the strength in Q1. Business-to-business services output had risen strongly, offsetting some weather-related weakness in other components of services and in the construction sector.
17: Bank staff now expected GDP growth of 0.5% in 2024 Q2 as a whole, stronger than the 0.2% rate that had been incorporated in the May Report. In light of this, the Committee discussed its view of the underlying trend in growth. The latest upside news to measured GDP over the first half of this year should be set against the surprisingly weak output data that had been observed during the second half of 2023. Recent indications from official data were stronger than an underlying rate of current output growth suggested by most business surveys, which had remained at around ¼% per quarter. Those surveys had nevertheless continued to signal that companies were expecting output growth to pick up further through the course of the year. For a given view of potential supply, this could suggest a risk that spare capacity in the economy might open up to a lesser degree than had been projected in the May Report.
18: Household consumption had increased by 0.2% in 2024 Q1, close to expectations in the May Report. Retail sales volumes had fallen sharply in April, in part reflecting weather-related volatility in spending. Real labour income had continued to pick up. Consumer confidence had also recovered further, with households continuing to view their own personal financial situations more positively. Nonetheless, perhaps reflecting the restrictive stance of monetary policy, households had remained sceptical about making major purchases and instead had favoured saving. Contacts of the Bank's Agents had reported a pickup in consumer demand in 2024 Q2 and were cautiously optimistic that growth could rise further over the course of this year.
19: Housing investment had been estimated to have grown by 4.1% in 2024 Q1, significantly stronger than had been expected in the May Report and perhaps indicating some easing in the impact that higher interest rates had been having. That upside surprise had reflected a continued upward trend in private housing repair and maintenance, alongside a small increase in new work after a period of pronounced weakness. The latest April housing construction output data had weakened for both of these components, in part potentially owing to adverse weather conditions. The UK House Price Index had risen over recent months.
20: Business investment had been estimated to have risen by 0.9% in 2024 Q1, with recent strength concentrated in spending on aircraft. The S&P Global/CIPS UK manufacturing investment goods output PMI had picked up recently, as had expected business investment growth in the Decision Maker Panel survey.
Supply, costs and prices
21: The continuing labour market data quality issues were a matter of increasing concern. Owing to very low achieved sample sizes, Labour Force Survey (LFS)-based estimates of labour market dynamics were still subject to considerable uncertainties. Key labour market flows data had not yet been fully reintroduced. It was therefore difficult to gauge the underlying state of labour market activity. The MPC had for some time utilised a wide range of data to inform its judgements on the labour market, including official data, business surveys and intelligence from the Bank's Agents.
22: The collective steer from a number of indicators, such as HMRC RTI payrolls employee data, a range of business surveys and the Bank's Agents' employment scores, pointed to underlying employment growth having slowed to broadly the same rate as population growth. This was in contrast to the LFS-based estimate of employment, which had reported a sharp decline.
23: The deceleration in underlying employment was in part likely to have reflected a further slowing in labour demand. The volume of vacancies had continued to fall back in May to around 10% above pre-Covid levels, although the pace of decline had slowed relative to last year. This decline in vacancies had been relatively broad-based across sectors, and a similar pattern had been reflected in the sectoral declines in demand for staff reported in the KPMG/REC survey.
24: In part reflecting this slowing labour demand, labour market tightness had continued to ease. The vacancies-to-unemployment ratio had fallen further in the three months to April, returning to around pre-Covid levels, which were still high by historical standards. The Bank's Agents' contacts had reported that recruitment difficulties had eased to near to their pre-Covid levels, although this was also still a historically high level. The KPMG/REC survey had indicated that staff availability had increased further in May. Nonetheless, an indicator model of underlying unemployment, which extracted a signal from indicators such as the claimant count, vacancies, measures of recruitment difficulties and other household indicators, had pointed to the underlying unemployment rate having been relatively flat in recent quarters, implying that the labour market was a little tighter than official data suggested. The LFS measure of the unemployment rate had increased by 0.6 percentage points since 2023 Q4.
25: Annual private sector regular Average Weekly Earnings (AWE) growth had eased from 6.1% in the three months to January to 5.8% in the three months to April, in line with the expectation made at the time of the May Monetary Policy Report. April was traditionally an important month for pay setting, with around 40% of the year's pay settlements taking effect alongside the annual increase in the National Living Wage. The collective steer from a range of pay growth indicators had continued to ease, with the staff's updated forecast for 2024 Q2 remaining in line with the projection in the May Report of annual growth of just over 5%.
26: Nevertheless, some recent data suggested a risk that near-term pay growth could moderate by less than had been expected in the May Report. The Bank's Agents' contacts had reported that recent pay settlements for 2024 were slightly above the average level recorded in the Agents' annual pay survey presented in the February Report. Contacts from those consumer-facing businesses that were most exposed to the National Living Wage had generally reported higher settlements. According to the Decision Maker Panel (DMP) survey in the three months to May, businesses' expectations for annual pay growth a year ahead had eased slightly to a rate of 4.5%, which was nevertheless still elevated. A counterpoint to these upside risks were the KPMG/REC monthly pay growth indices, which had continued to suggest a downside risk to future pay growth.
27: Twelve-month CPI inflation had fallen to 2.0% in May from 3.2% in March. The decline in headline CPI inflation had been accounted for largely by base effects across both goods and services. The May outturn had been close to the expectation made at the time of the May Report, although downside news from core goods price inflation had somewhat offset upside news from services price inflation.
28: Consumer goods price inflation had continued to ease as the cost pressures from previous external shocks had dissipated further. Households' domestic energy bills had continued to pull down headline inflation, declining at an annual rate of 27.1% in May. Food and non-alcoholic beverages price inflation had fallen to 1.7% in May compared to a peak of 19% in March 2023. Core goods price inflation had dropped to -0.1% in May, slightly below pre-Covid inflation rates. ONS producer price data had continued to point to easing cost pressures. Producer output and input price levels had been broadly flat in May, continuing a trend observed over the past year. The signals from other indicators, such as the S&P Global/CIPS manufacturing PMI input and output price indices and import prices, had also pointed to muted cost and price pressures for core goods.
29: The Committee discussed recent developments in indicators of consumer services price inflation and businesses' price-setting behaviour. Services price inflation had eased to 5.7% in May from 6.0% in March. This was a somewhat higher outturn than had been expected at the time of the May Report, however. Higher-frequency measures of services price inflation had picked up in the three months to May. Some of this strength had been accounted for by components of the services basket that were index-linked or regulated, for which prices were typically changed in April and remained in the annual inflation rate for 12 months, as well as strength in some of the more volatile components of this basket such as accommodation services. The monthly annualised inflation rates of a seasonally adjusted services price measure, which excluded indexed and volatile components, rents and foreign holidays, had averaged 5¼% over the three months to May, close to its average since mid-2023. CPI microdata suggested that the share of services prices that had increased, a measure of price-setting behaviour, had continued to ease, although this share had remained elevated by historical standards. Evidence from the DMP survey suggested that businesses expected the frequency of services price increases to normalise somewhat further over the course of this year. The S&P Global/CIPS PMI services input price index had risen sharply in April but had fallen to close to its historical average in May. The corresponding output price index had declined to its lowest level in three years.
30: Evidence on how profit margins in consumer-facing services would evolve had been mixed. On the one hand, intelligence from the Bank's Agents suggested that consumer-facing services businesses were facing price-sensitive consumers and so would find it more challenging to maintain profit margins in the face of continuing cost pressures, including any from labour costs. On the other hand, the latest DMP survey data suggested that businesses in consumer-facing sectors, such as wholesale and retail, and food and accommodation had experienced flat or declining profit margins over the previous year and were expecting to maintain or even slightly increase these margins over the year ahead. This suggested that margin expansion would not add significantly to inflation above and beyond realised cost growth.
31: Staff expected CPI inflation to increase slightly in the second half of this year, owing largely to the smaller drag on 12-month inflation from domestic energy bills.
32: Indicators of households' inflation expectations, an important channel of potential second-round effects on CPI inflation, had continued to moderate and had for the most part normalised to around their historical averages. The Bank of England/Ipsos Inflation Attitudes Survey's measure of median short-term inflation expectations had fallen to 2.8% in May, marginally below its historical average. The corresponding measure of medium-term expectations had remained close to, but below, its historical average. The Citi/YouGov indicator of households' short-term inflation expectations had eased to 3.1% in May, from 3.3% in April, but had remained slightly above its historical average. In contrast to developments in household measures, businesses' own price expectations, as reported in the DMP survey, had remained at more elevated levels, albeit also on a continued downward path.
The immediate policy decision
33: The MPC sets monetary policy to meet the 2% inflation target, and in a way that helps to sustain growth and employment.
34: The Committee noted that the timing of the general election on 4 July was not relevant to its decision at this meeting, which would as usual be made on the basis of what was judged necessary to achieve the 2% inflation target sustainably in the medium term.
35: In the MPC's May Monetary Policy Report projections, a margin of economic slack had been projected to emerge during 2024 and 2025 and to remain thereafter, in part reflecting the continued restrictive stance of monetary policy. CPI inflation had been expected to return to close to the 2% target in the near term, but to increase slightly in the second half of this year, to around 2½%, as declines in energy prices in the previous year fell out of the annual comparison. There had continued to be upside risks to the near-term inflation outlook from geopolitical factors. Conditioned on the market-implied path for Bank Rate at the time of the May Report and reflecting a margin of slack in the economy, CPI inflation had been projected to be 1.9% in two years' time and 1.6% in three years.
36: The Committee considered developments since the previous MPC meeting and how these informed the assessment that the risks from inflation persistence were receding.
37: UK GDP appeared to have grown more strongly than had been expected during the first half of this year. Business surveys, however, remained consistent with a slower pace of underlying growth, of around ¼% per quarter. Contacts of the Bank's Agents had reported a pickup in consumer demand in 2024 Q2 and most housing indicators had also shown signs of greater resilience over recent months.
38: The considerable uncertainty around estimates derived from the ONS Labour Force Survey meant that it was very difficult to gauge the evolution of labour market activity. Based on a broad set of indicators, the MPC judged that the labour market continued to loosen but that it remained relatively tight by historical standards.
39: The collective steer from a range of indicators of aggregate pay growth had continued to ease in the latest data, although there were some signs that this year's increase in the National Living Wage (NLW) could be having a greater than expected impact. The Bank's Agents' contacts had reported that recent pay settlements for 2024 were slightly above the average level recorded in the Agents' annual pay survey presented in the February Report.
40: Twelve-month CPI inflation had fallen to 2.0% in May from 3.2% in March, close to the May Report projection. Indicators of short-term inflation expectations had continued to moderate, particularly for households, which could have implications for future wage and price-setting decisions.
41: Services consumer price inflation had been 5.7% in May, down from 6.0% in March, but somewhat higher than had been projected in the May Report. This strength had in part reflected prices that were index-linked or regulated, which were typically changed only annually, and volatile components. Higher-frequency measures of services consumer price inflation had picked up in the three months to May. The S&P Global/CIPS PMI services input price index had risen sharply in April but had fallen back to close to its historical average in May. The corresponding output price index had declined to its lowest level in three years.
42: More generally, there continued to be a range of views regarding the risks of inflation persistence embodied in the CPI projection in the May Report. On the one hand, the continued unwinding of the past shocks to energy and other imported goods prices might moderate the extent to which employees and domestic firms would seek higher nominal pay and domestic selling prices to recover the reductions in real incomes that they had experienced in the past. As headline CPI inflation and short-term inflation expectations had fallen further, inflationary dynamics could therefore adjust as rapidly on the downside as they had done on the upside. On the other hand, there remained a risk that there had been a more enduring shift in price and wage-setting behaviour, perhaps associated with a higher degree of real income resistance or with changes in the relative wage structure. In addition, there was uncertainty around the near-term paths of demand and spare capacity in the economy, and hence around the extent to which these were likely to constrain domestic prices in the face of still-elevated cost pressures.
43: In contrast to the upside news in services consumer price inflation, core goods price inflation had been weaker than had been projected in the May Report. Although this series was often volatile, the downside news had been spread across several components of the goods basket and was consistent with broader developments in external cost pressures.
44: UK CPI inflation was expected to increase slightly in the second half of this year, as declines in energy prices last year fell out of the annual comparison.
45: The MPC's remit was clear that the inflation target applied at all times, reflecting the primacy of price stability in the UK monetary policy framework. The framework recognised that there would be occasions when inflation would depart from the target as a result of shocks and disturbances. Monetary policy would ensure that CPI inflation returned to the 2% target sustainably in the medium term.
46: Monetary policy would need to remain restrictive for sufficiently long to return inflation to the 2% target sustainably in the medium term in line with the MPC's remit. The Committee had judged since last autumn that monetary policy needed to be restrictive for an extended period of time until the risk of inflation becoming embedded above the 2% target dissipated. The Committee recognised that the stance of monetary policy could remain restrictive even if Bank Rate were to be reduced, given that it was starting from an already restrictive level.
47: Seven members judged that maintaining Bank Rate at 5.25% was warranted at this meeting. Headline CPI inflation had fallen back to the 2% target. The restrictive stance of monetary policy was weighing on activity in the real economy, was leading to a looser labour market and was bearing down on inflationary pressures. Key indicators of inflation persistence had continued to moderate, although they remained elevated.
48: There continued to be a range of views among these members about the extent of accumulated evidence that was likely to be needed to warrant a change in Bank Rate, and the degree to which incremental information was leading them to update materially their assessment of inflation persistence.
49: For some members within this group, the return of headline inflation to 2%, while welcome, was not necessarily indicative of the required sustained return to target. Continued high levels of, and upside news to, services inflation supported the view that second-round effects would maintain persistent upward pressure on underlying inflation. Wage growth had continued to exceed model-based estimates. Indicators of domestic demand were stronger than had been expected, and the risks to the outlook for activity were skewed to the upside. For these members, more evidence of diminishing inflation persistence was needed before reducing the degree of monetary policy restrictiveness.
50: For other members within this group, the upside news in services price inflation relative to the May Report did not alter significantly the disinflationary trajectory that the economy was on. This view was supported by evidence that the recent strength in services inflation included regulated and indexed components of the basket, and volatile components. The impact of the increase in the NLW this April on aggregate pay growth was unlikely to be as large in future. Such factors would not push up medium-term inflation. For these members, the policy decision at this meeting was finely balanced.
51: Two members preferred a 0.25 percentage point reduction in Bank Rate at this meeting. For these members, Bank Rate needed to become less restrictive now to enable a smooth and gradual transition in the policy stance, and to account for lags in transmission. CPI inflation had been on a firm downward trajectory for some time and had returned to the 2% target in May. It was forecast to stay close to 2% in the short term, consistent with the further easing in the labour market, forward-looking indicators of inflation and pass-through, and continued falls in inflation expectations. Given the subdued outlook for demand, the risks to inflation remaining sustainably at the target in the medium term were to the downside.
52: The MPC remained prepared to adjust monetary policy as warranted by economic data to return inflation to the 2% target sustainably. It would therefore continue to monitor closely indications of persistent inflationary pressures and resilience in the economy as a whole, including a range of measures of the underlying tightness of labour market conditions, wage growth and services price inflation. As part of the August forecast round, members of the Committee would consider all of the information available and how this affected the assessment that the risks from inflation persistence were receding. On that basis, the Committee would keep under review for how long Bank Rate should be maintained at its current level.
53: The Chair invited the Committee to vote on the proposition that:
- Bank Rate should be maintained at 5.25%.
54: Seven members (Andrew Bailey, Sarah Breeden, Ben Broadbent, Megan Greene, Jonathan Haskel, Catherine L Mann and Huw Pill) voted in favour of the proposition. Two members (Swati Dhingra and Dave Ramsden) voted against the proposition, preferring to reduce Bank Rate by 0.25 percentage points, to 5%.
Operational considerations
55: On 19 June, the stock of UK government bonds held for monetary policy purposes was £696 billion.
56: Finally, on the occasion of his 128th and final meeting and on behalf of Committee members past and present, the Chair expressed his appreciation to Ben Broadbent for his contributions to the work of the MPC since becoming a member in 2011.
57: The following members of the Committee were present:
- Andrew Bailey, Chair
- Sarah Breeden
- Ben Broadbent
- Swati Dhingra
- Megan Greene
- Jonathan Haskel
- Catherine L Mann
- Huw Pill
- Dave Ramsden
Sam Beckett was present as the Treasury representative.
David Roberts was also present on 12 and 17 June, as an observer for the purpose of exercising oversight functions in his role as a member of the Bank's Court of Directors.
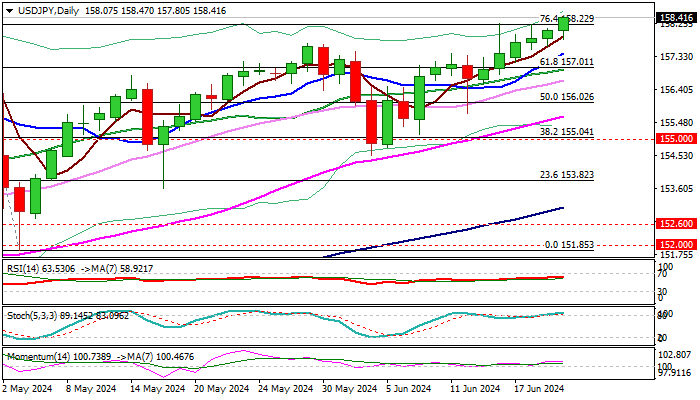
USD/JPY: Probes Again Through Pivotal Fibo Barrier, Inflated by Diverging Monetary Policies
USDJPY continues to trend higher and cracks pivotal Fibo barrier at 158.22 (76.4% of 160.19/151.85) which recently capped several attacks.
Sustained break here would generate fresh bullish signal for continuation of entire recovery from 151.85 (May 3 low) and open way for 159+ gains on stronger acceleration.
Daily studies are in full bullish mode, though overbought conditions may slow the action for consolidation.
Former top at 157.70 (May 29) should ideally contain dips and offer better levels to re-enter bullish market.
Caution on extension below 157.40 (rising 10DMA) which may sideline bulls
Fundamentals continue to work in favor of dollar, as Fed keeps hawkish stance and fade expectations for an early rate cut, while more dovish than expected BoJ last week added pressure on yen.
Res: 158.43; 159.00; 160.00; 160.19.
Sup: 158.22; 157.70; 157.40; 156.97.
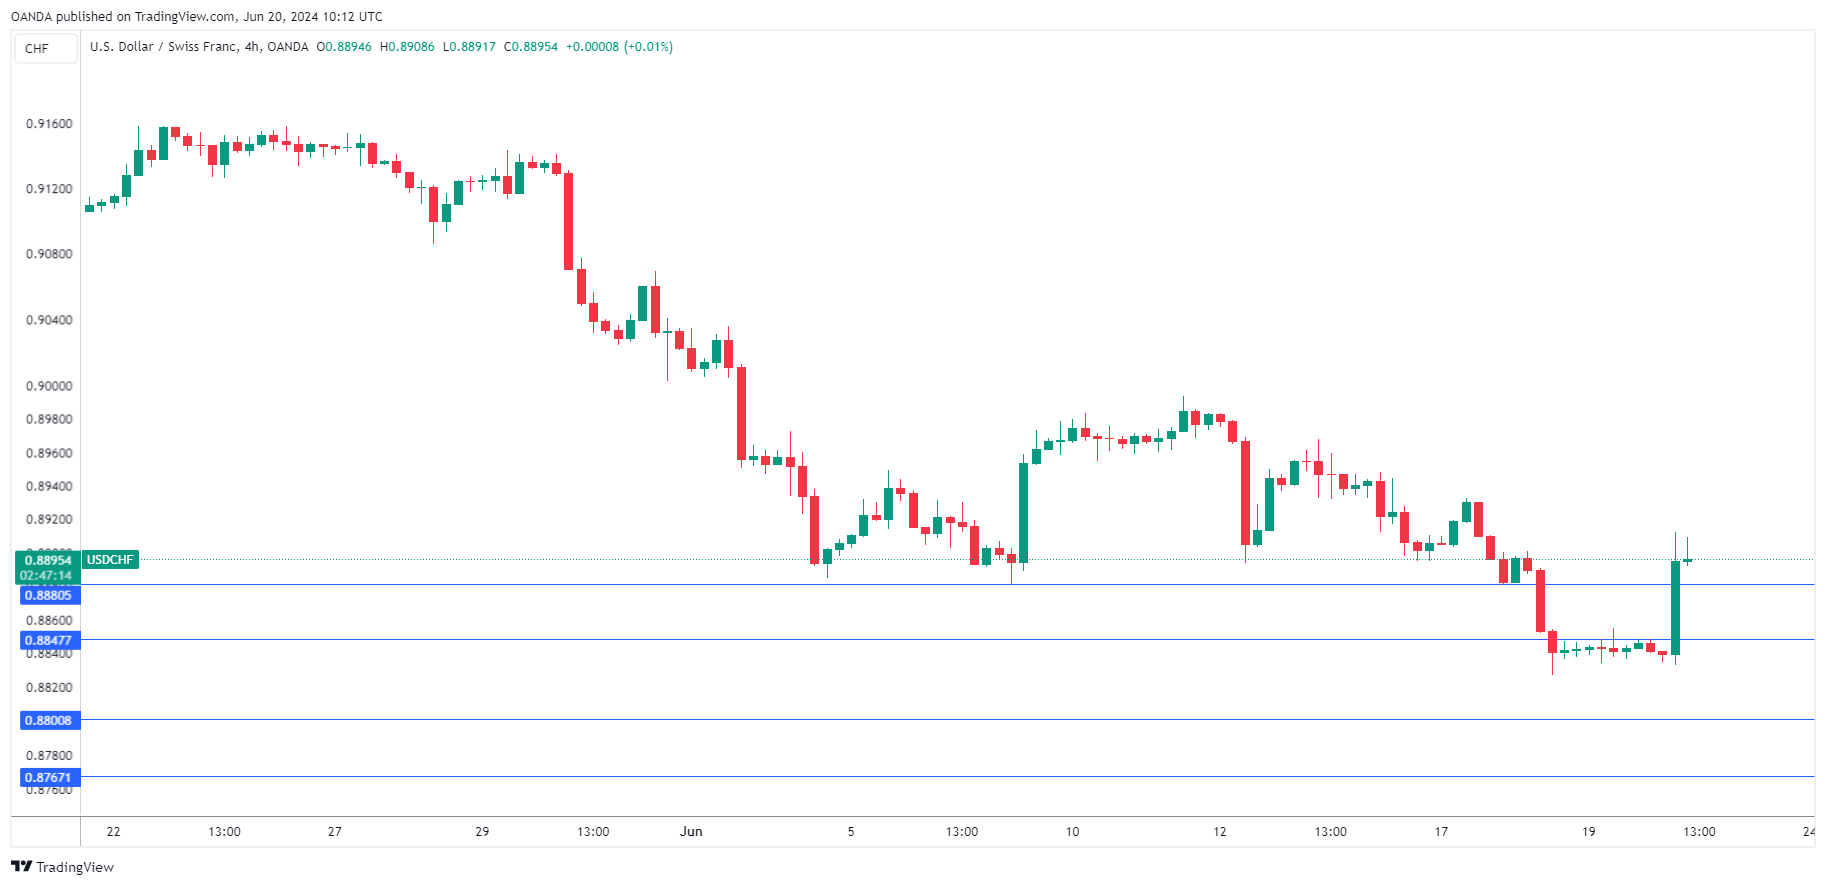
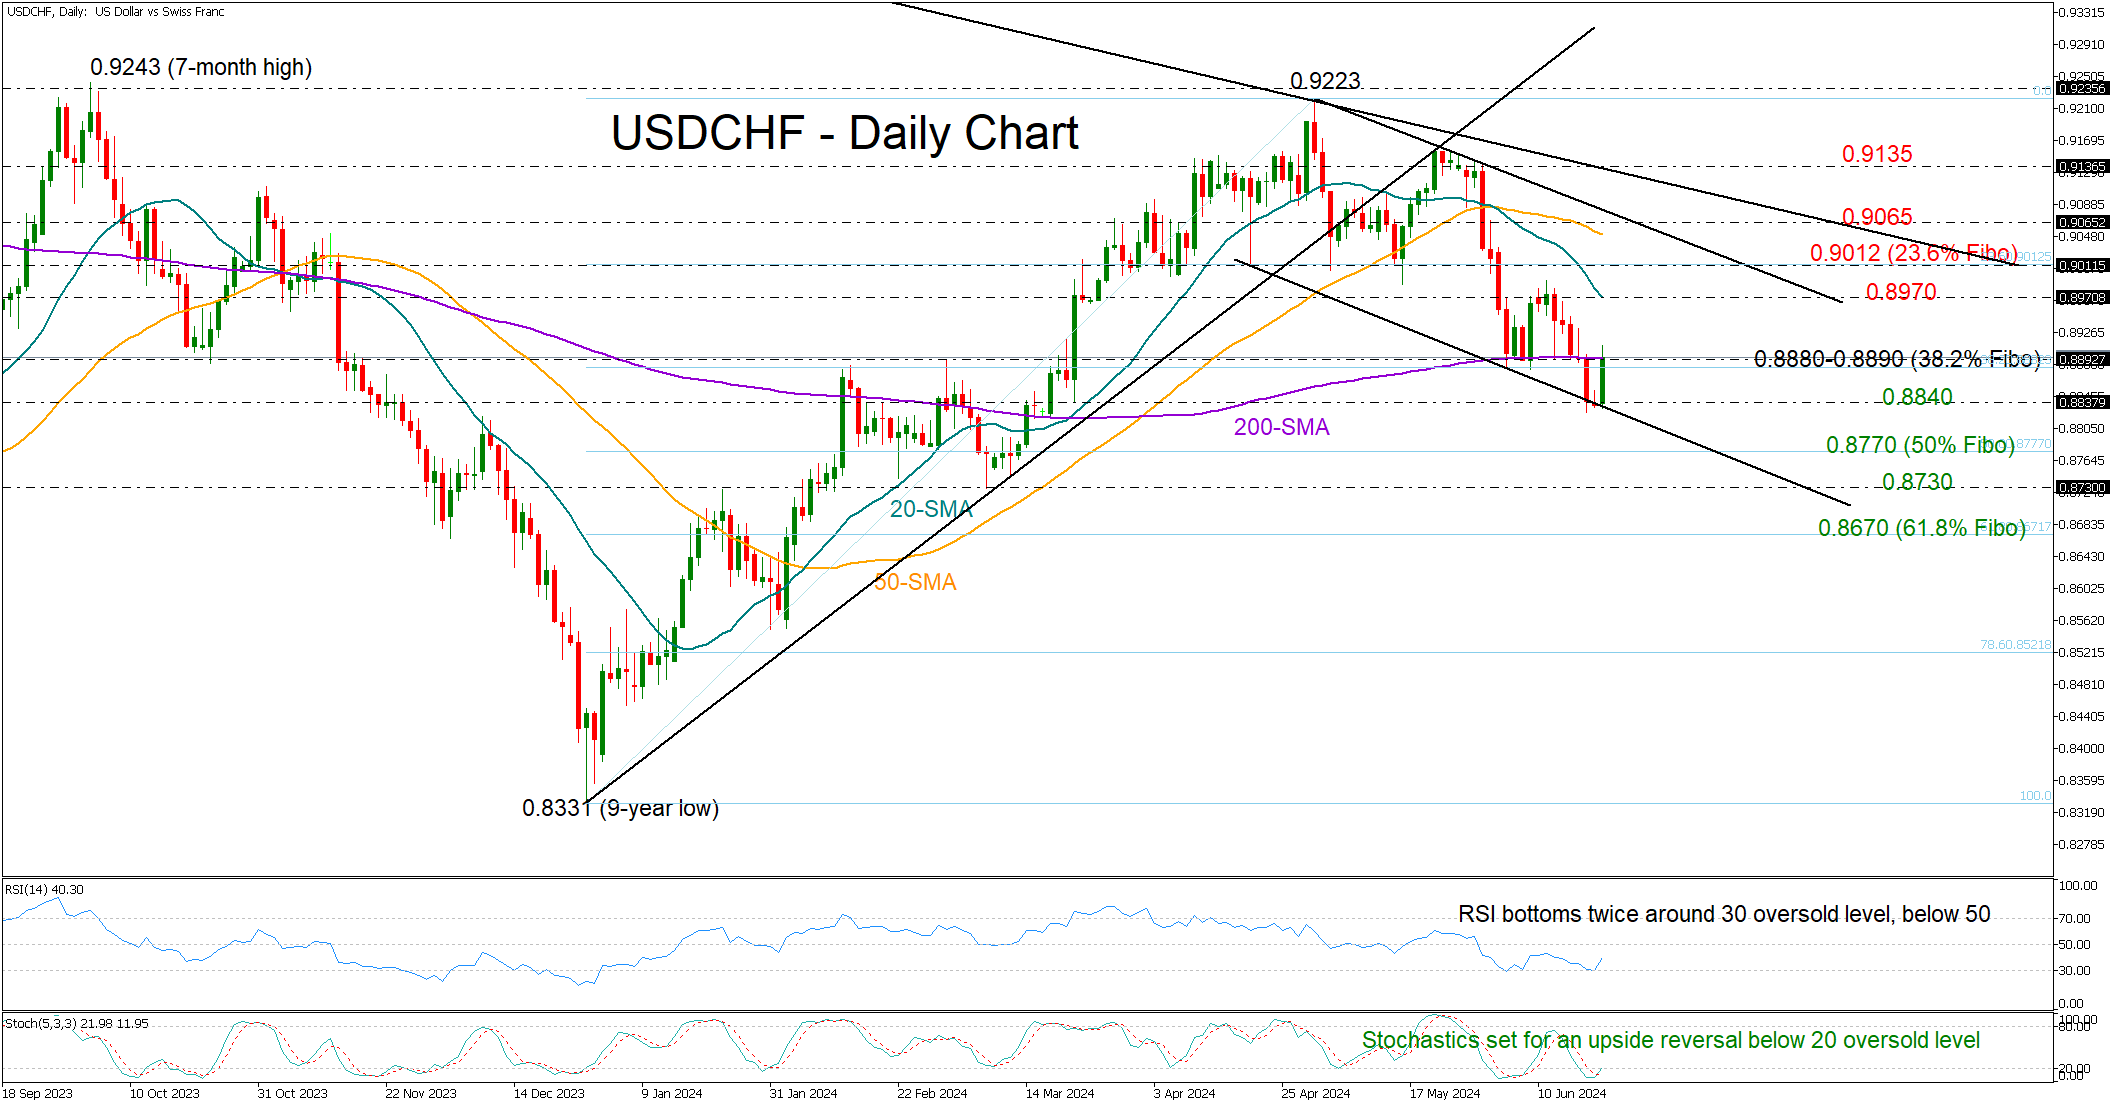
USDCHF Cheers on SNB Rate Cut
- USDCHF rises rapidly after SNB lowers interest rates to 1.25%
- Oversold signals favor the bulls; more upside needed for a positive outlook
USDCHF turned swiftly up to test its 200-day simple moving average (SMA) at 0.8890 after the Swiss National Bank (SNB) cut interest rates by a quarter percentage point for the second consecutive meeting despite some investors estimated no changes in borrowing costs.
The oversold signals coming from the RSI and the stochastic oscillator suggest that the rebound that took place today near the support line at 0.8840 has probably just started.
However, investors may preserve some caution until the 200-day SMA, which switched from support to resistance, gives the green light towards the 20-day SMA at 0.8970. The 23.6% Fibonacci retracement of the December-June upleg could be another hurdle near 0.9012 and the pair will have to claim it in order to reach the upper band of the short-term bearish channel at 0.9065. Even higher, the focus could shift to the descending trendline drawn from November 2022 at 0.9135.
Note that the gap between the 20- and 50-day SMAs continues to grow following the negative crossover between the lines. This questions the case of a bullish trend reversal.
Should the bears breach the channel’s floor at 0.8840, the sell-off could expand towards the 50% Fibonacci mark of 0.8770. Running lower, the price could stabilize near 0.8730 before meeting the 61.8% Fibonacci of 0.8670.
In a nutshell, USDCHF has the potential to start a bullish course in the coming sessions, though the outlook may not switch to bullish until the price breaks successfully above 0.9135.
SNB Cut Sends Swiss Franc Tumbling
The Swiss franc is down sharply on Thursday. USD/CHF is trading at 0.8897 in the European session, up 0.67% on the day.
Swiss National Bank trims rate to 1.25%
The Swiss National Bank kept investors hanging right up to the last minute as to whether or not it would cut rates at Thursday’s meeting. In the end, the SNB opted to cut rates for a second straight time and lowered the cash rate from 1.50% to 1.25%.
There were good reasons for the SNB either to hold or cut, which meant that either decision was likely to shake up the Swiss franc, which is exactly what happened. Inflation remained unchanged at 1.4% in May, in the upper half of the target band of 0% to 2%. Growth has been steady and the SNB could have easily decided to hold rates.
There were other factors at play which swayed policy makers to lower rates, such as the exchange rate. The Swiss franc has been on a tear, climbing 3.3% against the US dollar since late May. The SNB doesn’t want the Swissie to appreciate rapidly as this hurts the export sector, a key engine of the Swiss economy.
Thursday’s rate cut has already pushed the Swiss franc lower and the rate statement noted that the SNB “is willing to be active in the foreign exchange market as necessary”. This was a reminder that the central bank, which has intervened in the foreign exchange markets in the past, won’t hesitate to do so again in order to keep the exchange rate at a desirable level.
The SNB shocked the markets in March when it cut rates, the first major central bank to do so in the era of rate-tightening in order to curb high inflation. This decision was less of a surprise but had the same effect in sending the Swiss franc sharply lower.
USD/CHF Technical
- USD/CHF has pushed above resistance at 0.8847 and 0.8880 and is putting pressure on resistance at 0.8911
- There is support at 0.8800 and 0.8767