
Sample Category Title
Gold Eyes Higher Ground: Aiming for Upside Break
Key Highlights
- Gold seems to be forming a base above the $2,285 level.
- A key contracting triangle is forming with resistance at $2,332 on the 4-hour chart.
- EUR/USD is recovering higher toward the 1.0780 resistance.
- Oil prices gained bullish momentum above the $80.00 resistance.
Gold Price Technical Analysis
Gold prices remained well-bid above the $2,280 zone against the US Dollar. There was a minor recovery wave above the $2,300 and $2,310 levels.
The 4-hour chart of XAU/USD indicates that the price climbed higher and tested the $2,335 resistance zone. However, the bears were active near the 100 Simple Moving Average (red, 4 hours) and the 200 Simple Moving Average (green, 4 hours).
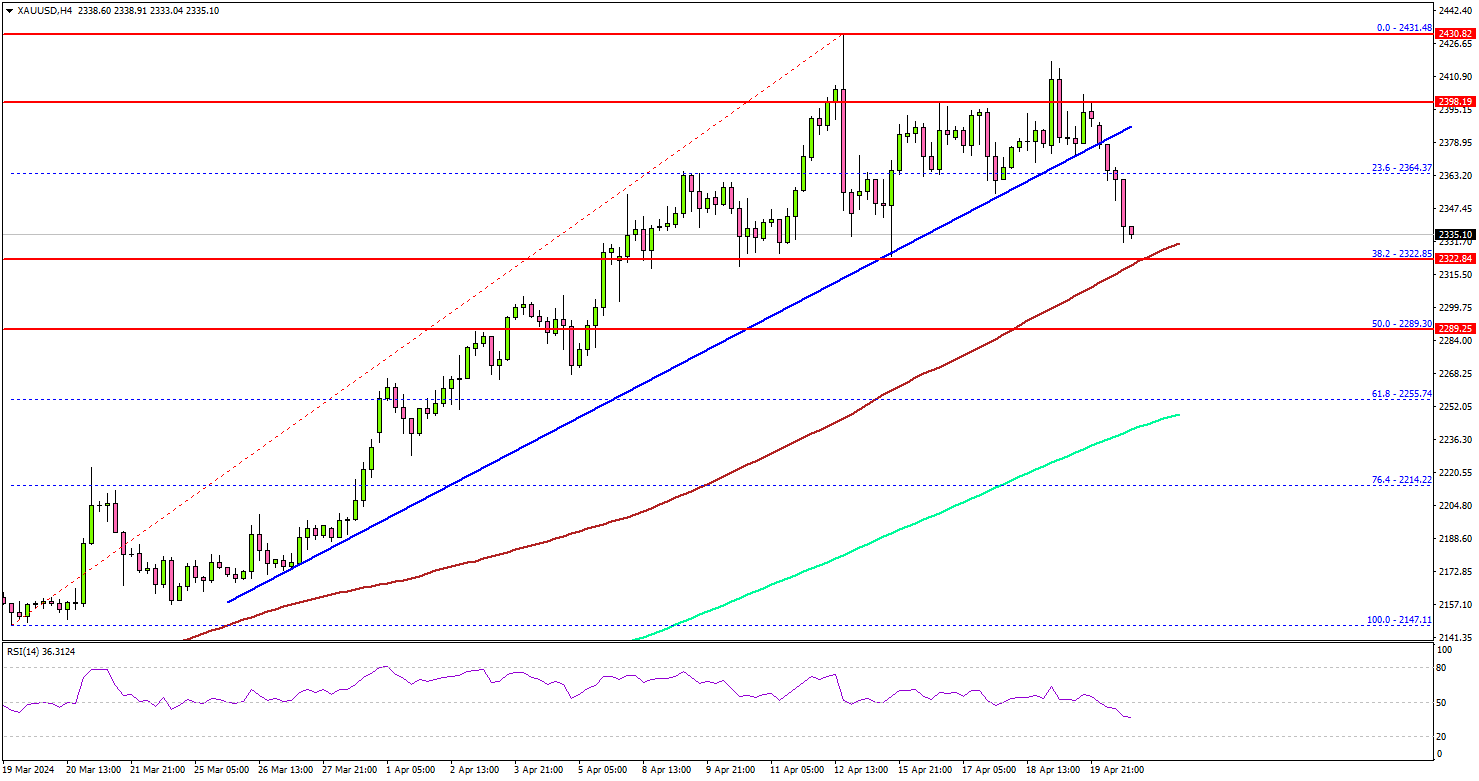
There is also a key contracting triangle forming with resistance at $2,332 on the same chart. A clear move above the triangle resistance and the 100 Simple Moving Average (red, 4 hours) could open the doors for a steady increase.
The first major resistance is now near $2,340, above which the price could accelerate higher toward the $2,365 level. Any more gains might send Gold toward the $2,385 resistance.
On the downside, there is a key support forming near the $2,310 level. A downside break below the $2,310 support might call for more downsides. The next major support is near the $2,300 level. Any more losses might send Gold prices toward $2,285.
Looking at Oil, the bulls were able to push the price above the $80.00 resistance and they could aim for more upsides.
Economic Releases to Watch Today
- UK Consumer Price Index for May 2024 (YoY) – Forecast +2.2%, versus +2.3% previous.
- UK Core Consumer Price Index for May 2024 (YoY) – Forecast +3.5%, versus +3.9% previous.
Fed’s Collins warns against overreacting to short-term inflation data
In a speech, Boston Fed President Susan Collins cautioned against overreacting to "a month or two" of improvements in inflation data. She emphasized, "It is too soon to determine whether inflation is durably on a path back to the 2% target." Collins urged patience in the approach to monetary policy, reflecting the need for a cautious stance.
"In my view, the data suggest an economy with demand and supply coming into better balance, as required to restore price stability," Collins said. "However, this process may just take more time than previously thought."
Fed’s Kugler encouraged by renewed progress on inflation
In a speech, Fed Governor Adriana Kugler acknowledged that while inflation remains too high, she is "encouraged" by the overall progress and outlook. Kugler expressed "cautious optimism" based on recent economic and inflation data, suggesting that Fed is on track towards its 2% inflation target.
She noted that progress may have stalled in the first quarter of the year, but subsequent information on economic activity, the labor market, and inflation indicates "renewed progress."
Kugler indicated that, "If the economy evolves as I am expecting, it will likely become appropriate to begin easing policy sometime later this year."
Fed’s Logan: Neutral rate may be higher post-pandemic, inflation risks persist
In a moderated Q&A session overnight, Dallas Fed President Lorie Logan stated, "From a monetary policy perspective, we're in a good position, we're in a flexible position to watch the data and be patient." She highlighted the need for "several months" of favorable data to gain confidence that inflation is on track to the 2% target.
Despite signs that the economy is balancing better, Logan expressed concerns about persistent upside risks to inflation. She also suggested that the neutral rate setting may now be higher than pre-pandemic levels.
"We've just been surprised by how well the economy has performed at these higher levels of rates," she noted. Logan attributed this to structural changes in the economy, implying that the neutral rate might be higher than it was in the decade before the pandemic.
Fed’s Musalem calls for sustained favorable conditions before rate cuts
In his debut speech, St. Louis Federal Reserve President Alberto Musalem emphasized the need for sustained favorable conditions before considering a reduction in interest rate. He stated that he needs to see a period of favorable inflation, moderating demand, and expanding supply, which could take "months, and more likely quarters" to materialize.
He also did not rule out additional rate hikes if inflation remains significantly above 2% or if it reaccelerates, although he noted this was not his base case scenario.
Musalem also expressed uncertainty about whether the current monetary policy stance is sufficiently restrictive, pointing out that financial conditions "feel accommodative for some parts of the economy while restrictive for others."
AUDUSD Wave Analysis
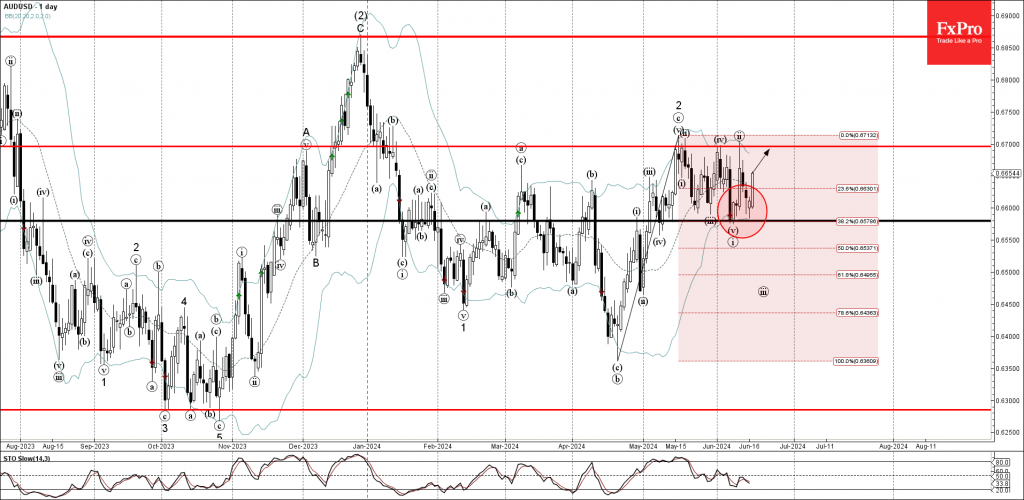
- AUDUSD reversed from key support level 0.6580
- Likely to rise to resistance level 0.6700
AUDUSD currency pair recently reversed up from the key support level 0.6580 (which has been reversing the price from the start of May) coinciding with the lower daily Bollinger Band.
The support level 0.6580 was further strengthened by the 38.2% Fibonacci correction of the previous upward impulse from April.
Given the strength of the support level 0.6580 and the strong USD sales, AUDUSD currency pair can be expected to rise further to the next resistance level 0.6700, which stopped the previous waves 2, iv and ii.
CADCHF Wave Analysis
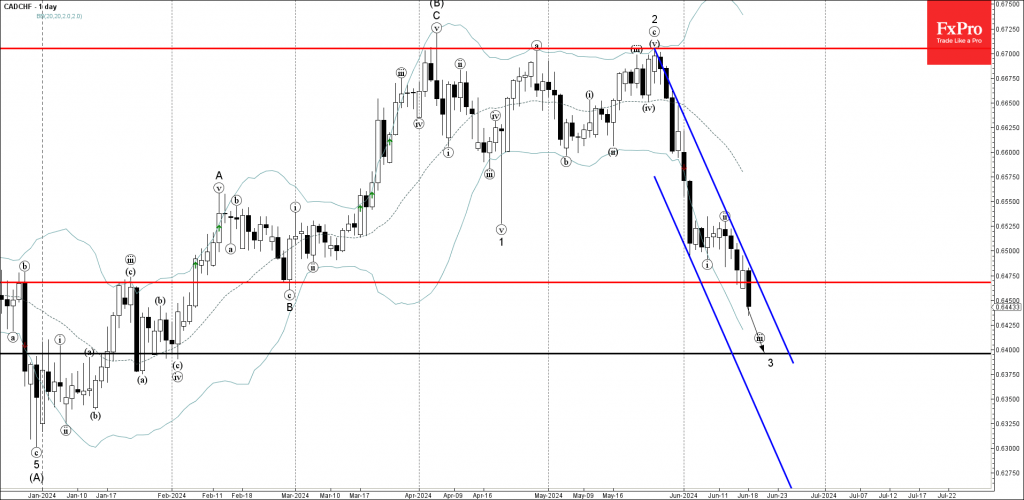
- CADCHF broke key support level 0.6465
- Likely to fall to support level 0.6400
CADCHF currency pair under the bearish pressure after breaking the key support level 0.6465 (which started the impulse wave C in February).
The breakout of the support level 0.6465 accelerated the active impulse waves 3 and iii, which belong to the higher impulse wave (C) from August.
CADCHF currency pair can be expected to fall further to the next support level 0.6400, low of wave iv, and the target for the completion of the active impulse wave 3.
NZD: Market Breakdown Ahead of GDP Release
The NZDUSD pair rose nearly a quarter of a percent to the 0.6110s after the US Dollar weakened following disappointing US Retail Sales data for April and May. The lower-than-expected retail sales growth in May and downward revisions for April indicate a slowdown in US consumer spending, leading to revised market expectations of future US interest rate cuts. The probability of the Federal Reserve cutting rates by 0.25% in September increased from 55% to 60%, with a 68% chance of a total 0.25%-0.50% cut by then. Meanwhile, the New Zealand Dollar remains broadly weaker due to a slump in the country's services sector and consecutive quarters of negative GDP growth, suggesting a recession and increasing the likelihood of a rate cut by the Reserve Bank of New Zealand in November. Despite recent Fed officials' hawkish comments, the NZD's performance is weighed down by domestic economic challenges and rate cut expectations.
EURNZD – D1 Timeframe
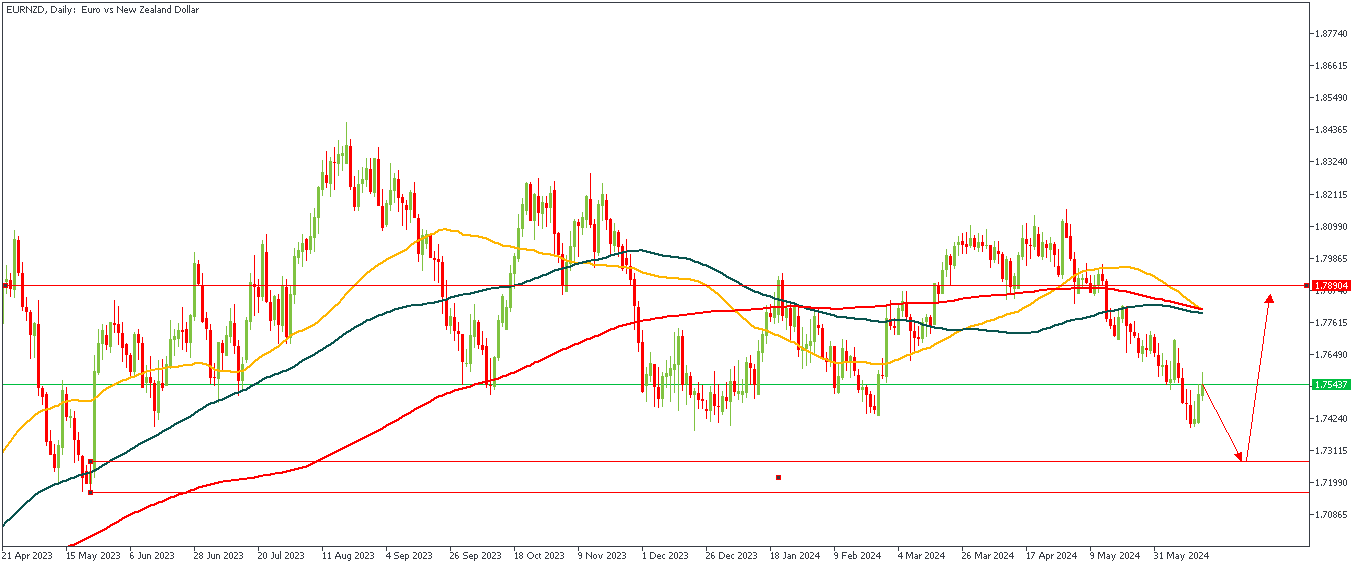
The rectangular zone on the daily timeframe chart of EURNZD above depicts a drop-base-rally demand zone that was formed right after a sweep of liquidity from the previous low; making it a pretty strong area of price action to consider. Also, the zone fits into the 88% region of the Fibonacci retracement tool, thus confirming my bullish sentiment.
Analyst’s Expectations:
- Direction: Bullish
- Target: 1.78904
- Invalidation: 1.71636
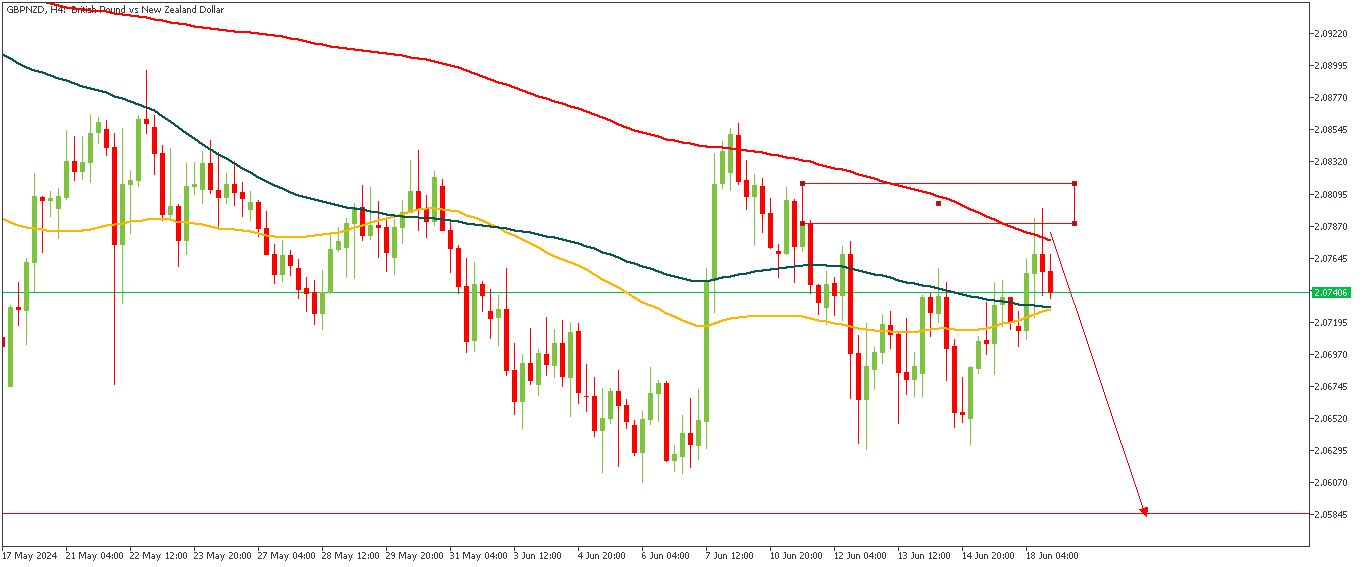
GBPNZD – H4 Timeframe
GBPNZD on the 4-hour timeframe presents a clean argument in favor of the bearish sentiment. Here, we see price trade into a supply zone that is nested on top of the 200-day moving average and get rejected immediately after. This gives an indication that the current move could play out as a bearish impulse; hence, my sentiment on GBPNZD is bearish.
Analyst’s Expectations:
- Direction: Bearish
- Target: 2.05870
- Invalidation: 2.08167
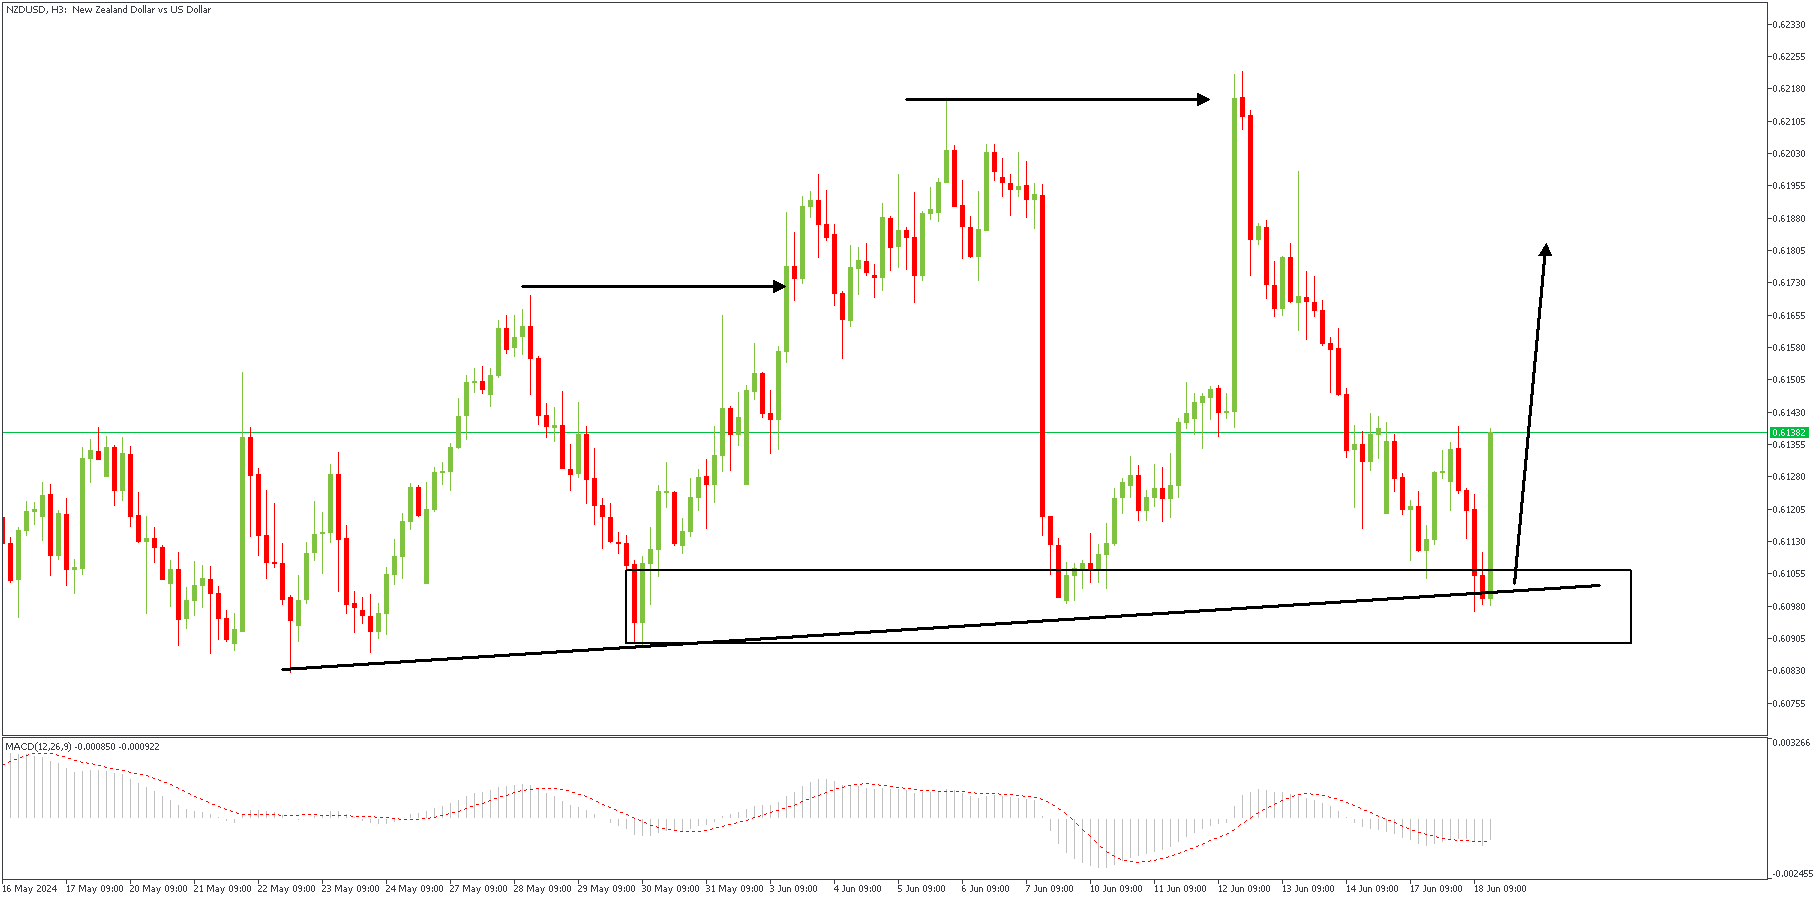
NZDUSD – H3 Timeframe
NZDUSD on the 3-hour timeframe has just bounced off the drop-base-rally demand zone. The trendline support provides an additional confluence as it overlaps the demand zone. The final piece that brings it all together is the MACD indicator’s signal of a bullish onset as seen on the indicator window of the attached chart. These factors point me clearly in favor of a bullish move for NZDUSD.
Analyst’s Expectations:
- Direction: Bullish
- Target: 0.60430
- Invalidation: 0.61565
Fed’s Barkin optimistic on inflation, emphasizes “sustainment” and “broadening”
Richmond Fed President Thomas Barkin expressed optimism about the inflation outlook in an interview with MNI Webcast. Barkin noted that we are "on the back side of inflation," indicating that inflationary pressures are easing.
He highlighted that the next several months will be critical in gaining more insights and that Fed is well-positioned from a policy standpoint to react and ease montary policy.
Barkin emphasized two key themes: "sustainment" and "broadening."
Sustainment refers to maintaining a downward trend in both headline and core inflation, ensuring that it continues on a path towards 2% target. Broadening implies that this trend should be consistent across a wide range of goods and services in the inflation basket.