Sample Category Title
Eurozone CPI finalized at 2.6% in May, core at 2.9%
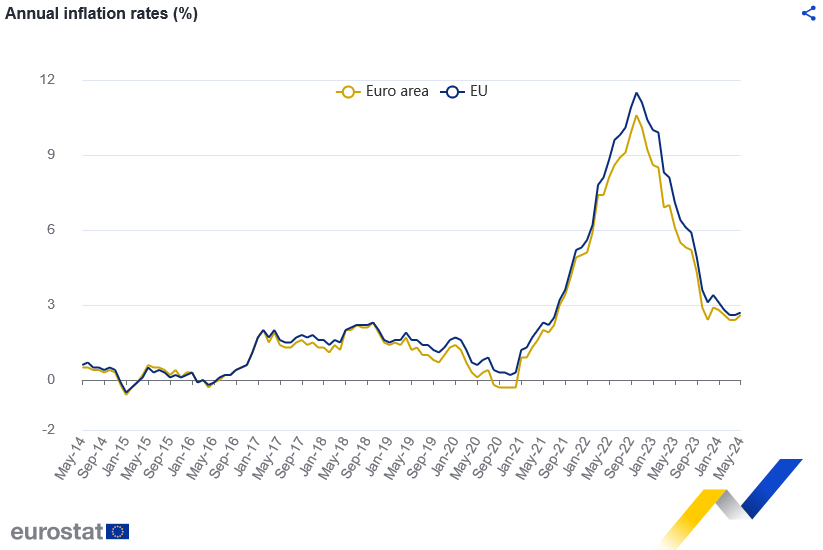
Eurozone CPI was finalized at 2.6% yoy in May, up from April's 2.4% yoy. CPI core (ex energy, food, alcohol & tobacco) was finalized at 2.9% yoy, up from prior month's 2.7% yoy. The highest contribution to the annual inflation rate came from services (+1.83 percentage points, pp), followed by food, alcohol & tobacco (+0.51 pp), non-energy industrial goods (+0.18 pp) and energy (+0.04 pp).
EU CPI was finalized at 2.7% yoy, up from April's 2.6% yoy. The lowest annual rates were registered in Latvia (0.0%), Finland (0.4%) and Italy (0.8%). The highest annual rates were recorded in Romania (5.8%), Belgium (4.9%) and Croatia (4.3%). Compared with April, annual inflation fell in eleven Member States, remained stable in two and rose in fourteen.
German ZEW ticks up to 47.5, sentiment and situation stagnate
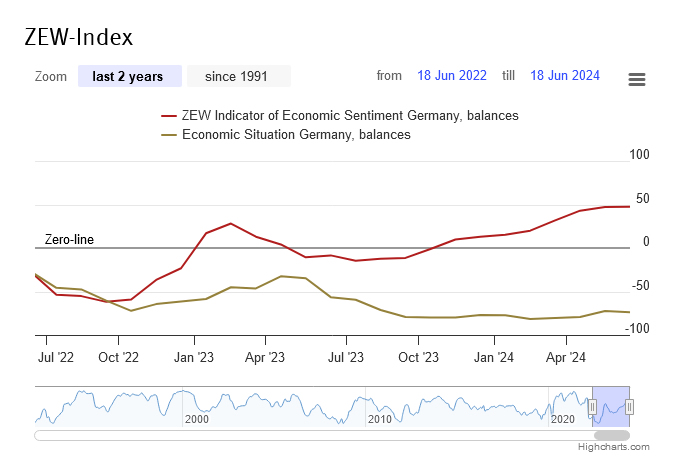
German ZEW Economic Sentiment ticked up from 47.1 to 47.5 in June, below expectation of 50.0. Current Situation Index fell from -72.3 to -73.8, below expectation of -69.0.
Eurozone ZEW Economic Sentiment rose from 47.0 to 51.3, above expectation of 47.2. Current Situation Index was unchanged at -38.6.
ZEW President Professor Achim Wambach said: "Both the sentiment and the situation indicators stagnate. These developments must be interpreted in the context of a constant situation indicator for the eurozone as a whole. In contrast, the inflation expectations of the respondents increase, which is likely related to the inflation rate in May, which turned out higher than what was expected."
GBPUSD Falls to a Fresh 1-Month Low
- GBPUSD declines to its lowest level since May 17
- Momentum indicators ease but remain in positive zones
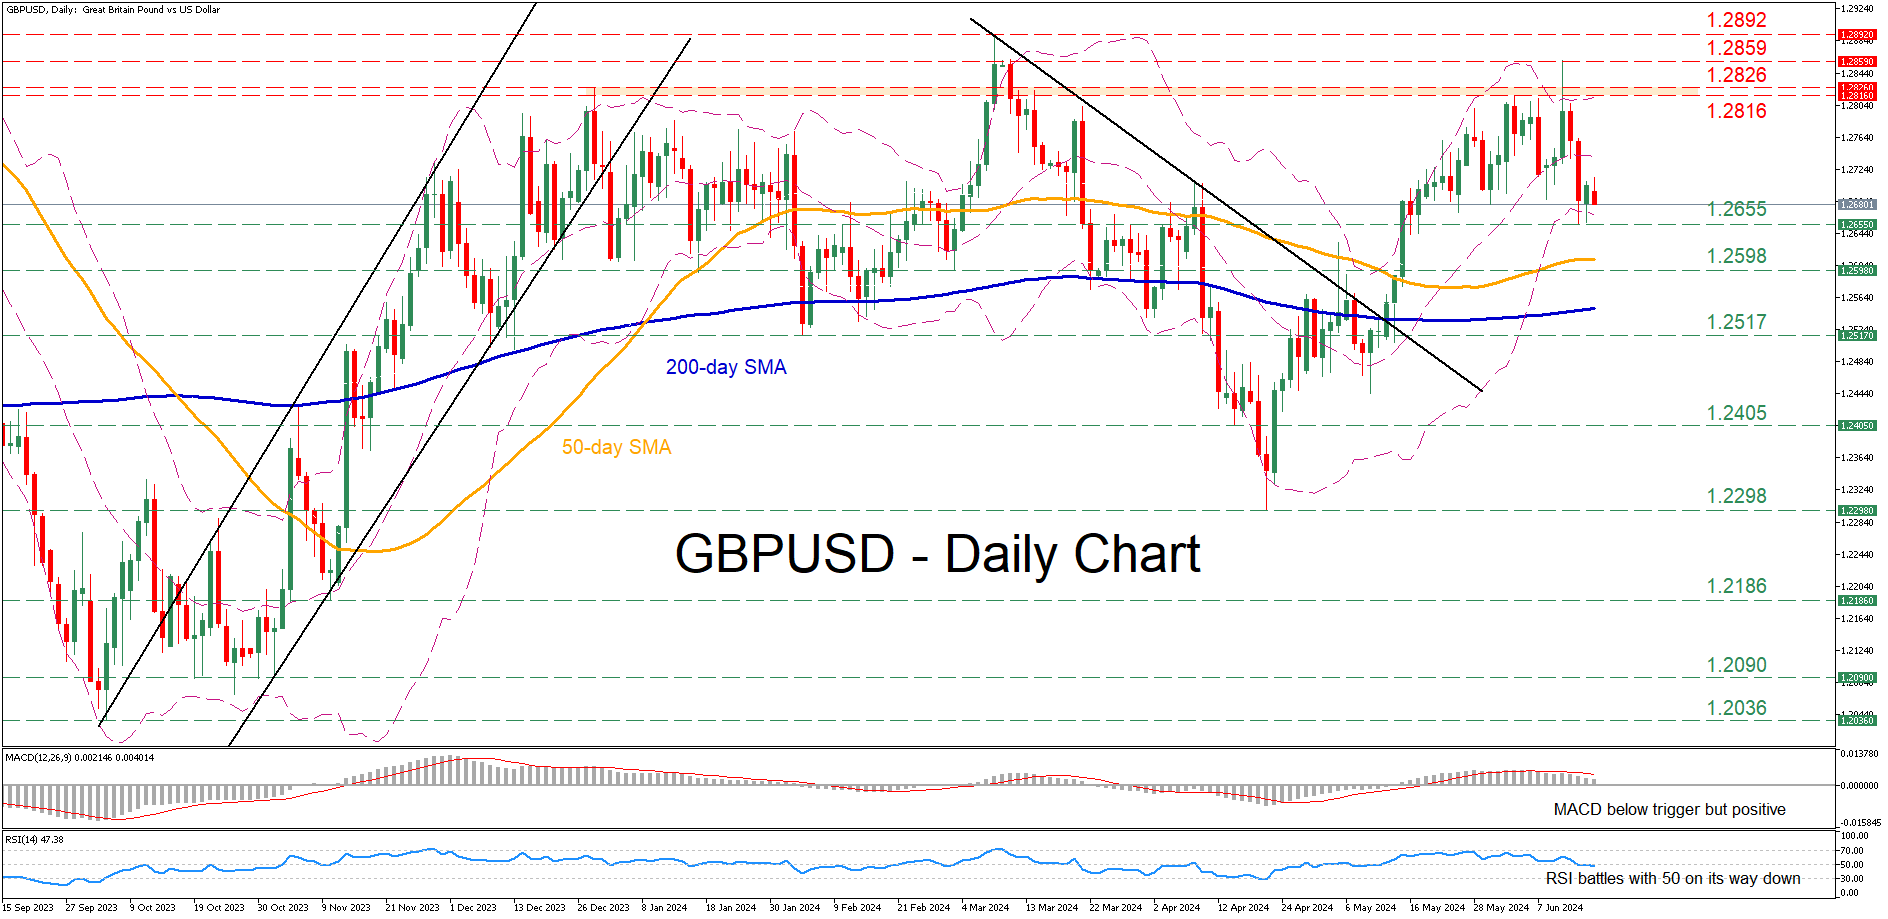
GBPUSD was in a steady recovery following its bounce off the 2024 bottom of 1.2298, with the price violating both the 50- and 200-day simple moving averages (SMAs). In the near term, although the pair surged to a three-month high of 1.2859, it quickly reversed lower.
Should the pullback extend, the recent support of 1.2655 could act as the first line of defence. Further retreats could cease around 1.2598, a region that held strong both in January and March. Sliding beneath that floor, the price could descend towards the February bottom of 1.2517.
Alternatively, if the bulls manage to erase the latest setback, immediate resistance could be found at the 1.2816-1.2826 range, defined by the most recent peak and the December 2023 high. Failing to halt there, the pair could storm towards the three-month high of 1.2859. A violation of that region could set the stage for the 2024 peak of 1.2892.
Overall, GBPUSD experienced a strong downward move after posting a fresh three-month high. Nevertheless, a break below the 50-day SMA is needed for the short-term outlook to turn bearish.
RBA More Alert and Less Certain in its Inflation Fight
The RBA left the cash rate on hold at 4.35%, but their rhetoric suggests the Board is more alert to upside inflation risks. Indeed, the RBA Board appears less certain that inflation is moderating as they’d like and there’s lingering concerns about persistent price pressures.
The Reserve Bank left the cash rate unchanged at 4.35% in a widely-expected decision.
The RBA last hiked in November 2023 and a ‘high for longer’ theme has played out since.
Importantly, in today’s meeting the Board debated hiking the cash rate or leaving the cash rate alone. The Board did not consider cutting the cash rate. The decision was made to stay the course.
Michelle Bullock in her press conference stuck to her usual mantra that the board is not ruling anything in or out. However, she highlighted that the evidence on inflation is that “demand is still too strong.”
Governor Bullock’s remarks, together with the changes to the accompanying Board statement, reveal the RBA has become more alert to upside inflation risks. Additionally, the Board appears less confident inflation is moving sustainably towards the inflation target within a reasonable timeframe.
In perhaps one of the more telling remarks of the press conference, Bullock said “we need a lot to go our way if we are going to bring inflation down to the 2-3% target” and the economy’s narrow path is “getting a bit narrower.”
However, she also emphasised that the case for a rate rise isn’t increasing. Instead, there are a few factors that are making the Board a bit more alert to the upside risks. It means the data flow between now and the next Board meeting will be critical, especially the June quarter inflation read and data on the labour market.
Governor Bullock’s vigilant rhetoric was echoed in the tone of the Board statement where several notable changes were made.
First, the RBA referred to inflation as “proving persistent” and the statement called out the persistence of services price inflation as a key uncertainty. In the press conference, Bullock suggested the monthly inflation measure does not give a solid enough read on inflation momentum, meaning they must rely on the less timely quarterly inflation report.
Second, the statement notes that output growth in most advanced economies appears to have troughed. The RBA has previously highlighted the downside risks to global growth could pose to the Australian economy.
Third, the statement introduced a reference to supply chain risks, relating to geopolitical risks and likely reflecting the recent pick up in shipping costs.
Finally, the last paragraph, arguably the most critical of the statement, stresses the step up in the RBA’s alertness. The RBA notes that while recent data have been mixed, they flag that it has “reinforced the need to remain vigilant to upside risks to inflation.”
Moreover, in the final sentence of the statement, the Board has reinstated the words indicating “they will do what is necessary to achieve that outcome”. This line was last used in February 2024 and the return of these words underscores that the Board is more attentive to upside risks and willing to respond should these risks materialise.
The reference to house prices also returned to the statement alongside the lift in household wealth. House prices were last mentioned in a Board statement late last year.
More broadly, another key area of uncertainty is the outlook for consumption. Indeed, the word uncertainty has been used more times today than in any Board statement in the last six months.
The RBA expects consumption growth to strengthen, as lower inflation and tax cuts drive a lift in real disposable incomes later this year. But the RBA also sees a possible scenario where consumption growth lifts more slowly and where the improvement in household incomes is mostly saved. The larger than previously estimated run down in savings buffers could be consistent with this scenario where households save a larger share of the tax cuts and cost of living support measures to help rebuild buffers. This was called out as a particular area of uncertainty; the RBA was unsure of the extent to which low savings was a sign that consumers were confident enough to spend or unable to save due to pressures on income.
The RBA next meets on August 6 and just before this meeting, the quarterly inflation report is released on July 31. The RBA will have a more comprehensive read on inflation and the economy at the time of this meeting, although it will need to digest the impact of the Stage 3 tax cuts and other fiscal support measures that come into effect on July 1. These effects will not become fully apparent until well after the August meeting.
Our inflation forecasts for the upcoming June quarter report are below that of the RBA’s, leaving us comfortable with our view that the next move in the cash rate will be down and arrive in November. But we acknowledge there’s a greater risk of rate relief slipping into next year. Swap markets have no rate cuts priced for this year and two rate cuts priced in for 2025. The timing of the first rate cut has been pushed out from February to April next year after today’s meeting.
If the concerns around persistent price pressures continue, we think the RBA is more likely to keep the cash rate on hold for longer than to hike again, but the RBA remains data dependent and the upcoming data will be telling.
Nasdaq 100 Index Reaches 20,000 Points for the First Time
On 30 May, we noted some uncertainty in the price behaviour of the Nasdaq 100 (US Tech 100 mini on FXOpen) near the resistance level of 18,840, as shown by arrow #1.
Following this, the price declined and tested the former resistance at 18,250 (indicated by arrow #2) – the long lower shadow on the candle indicated aggressive demand (more details in the article on the Hammer pattern).
This test gave the bulls confidence to break through the 18,840 resistance.
In June, the price continued to rally within the ascending channel (shown in green), which is part of a larger ascending channel (shown in blue), driven by:
→ prospects for AI implementation;
→ prospects of Fed rate cuts.
Yesterday, the Nasdaq 100 (US Tech 100 mini on FXOpen) rose by approximately 1.2%, reaching the psychological level of 20,000 points. This record was supported by influential analysts raising their forecasts for US stock markets. For example:
→ Goldman Sachs raised the year-end 2024 target for the S&P 500 (US SPX 500 mini on FXOpen) from 5200 to 5600;
→ Evercore ISI increased its forecast for the same index from 4750 to 6000.
Market sentiment was also buoyed by the anticipation of several comments from FOMC members scheduled for this week. These might confirm the Fed's intention to cut rates as early as September this year.
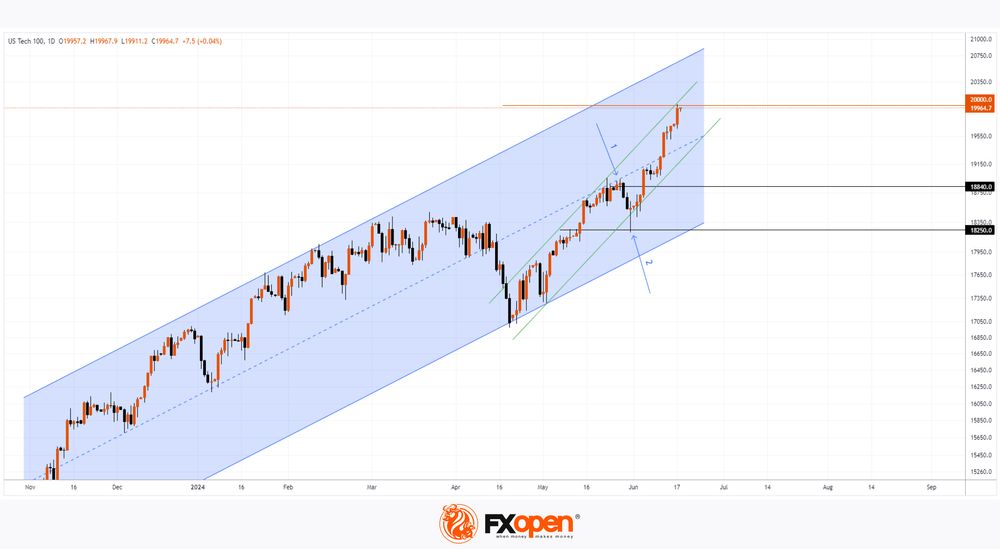
Technical analysis of the Nasdaq 100 (US Tech 100 mini on FXOpen) shows that:
→ The price is in the upper half of the blue channel, with its median line potentially serving as support.
→ The price is near the upper boundary of the green channel, which can be considered resistance. This suggests that the price might retreat from the psychological level of 20k towards the lower boundary of the green channel.
It is possible that the current bullish drivers will remain relevant until September, allowing the Nasdaq 100 (US Tech 100 mini on FXOpen) to continue rising towards the upper boundary of the blue channel.
Trade global index CFDs with zero commission and tight spreads. Open your FXOpen account now or learn more about trading index CFDs with FXOpen.
This article represents the opinion of the Companies operating under the FXOpen brand only. It is not to be construed as an offer, solicitation, or recommendation with respect to products and services provided by the Companies operating under the FXOpen brand, nor is it to be considered financial advice.
European Currencies Adjust to Support Levels: Is Growth Possible?
A week rich in macroeconomic data contributed to the decline of the euro, yen, and pound. Notably, the following events were significant:
- Inflation falling for the second consecutive month (0.2% against the expected 0.3%);
- The publication of the updated forecast from the Federal Reserve (one reduction in the federal funds rate by 0.25%, presumably in September).
Nonetheless, despite the hawkish stance of the Federal Reserve and the steady slowdown in inflation, European currencies managed to stay above key levels relative to the dollar, even laying the groundwork for forming reversal patterns.
GBP/USD
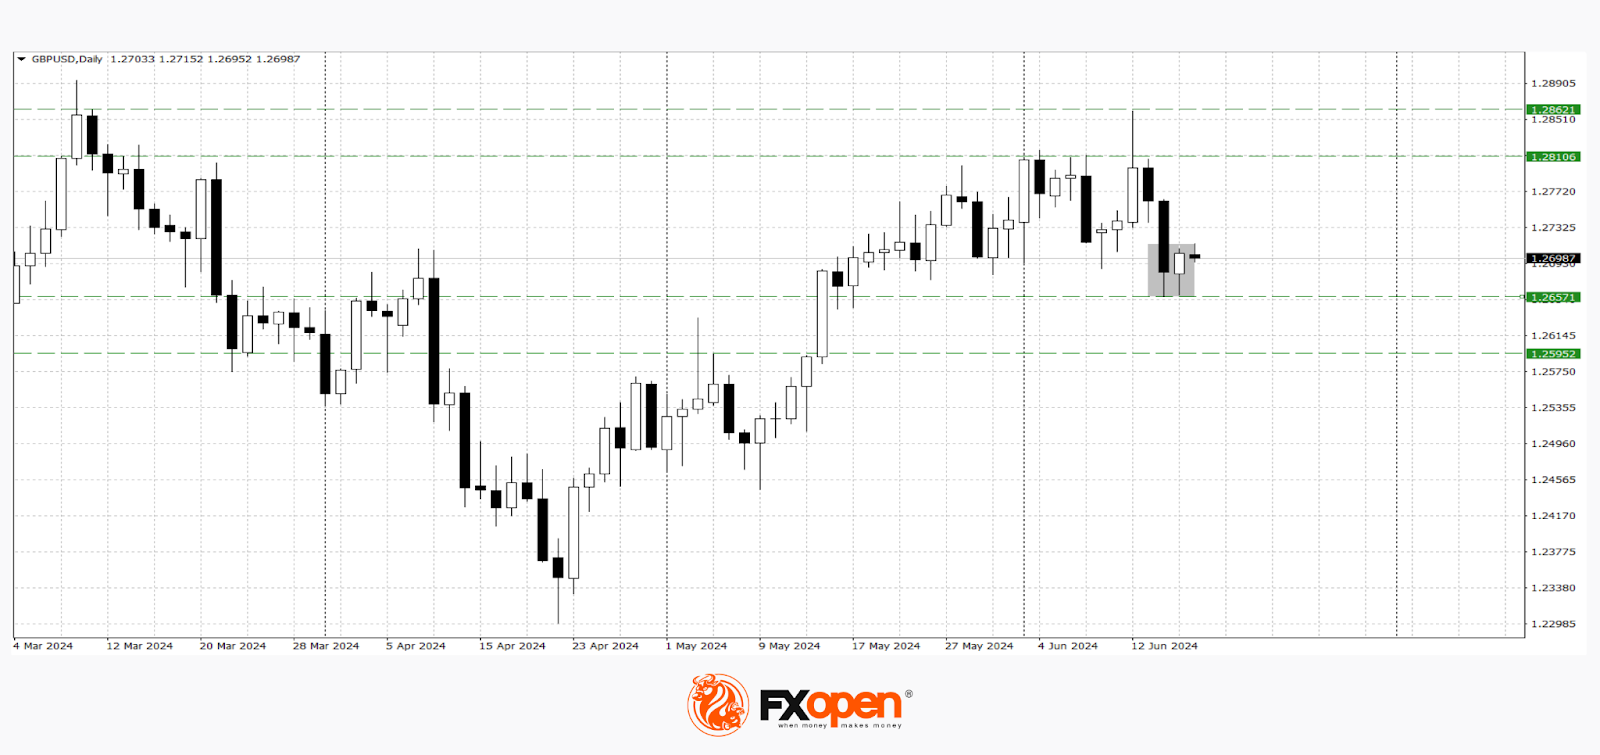
According to the technical analysis of the GBP/USD pair on the daily timeframe, a "piercing candle" pattern was formed yesterday. If the pair closes with any bullish candle today, the price might reach recent highs around 1.2860-1.2810. A resumption of the downtrend is possible with a confident hold below 1.2650. The following news might impact GBP/USD pricing:
- Today at 15:30 (GMT +3:00) the US core retail sales index for May;
- Today at 15:30 (GMT +3:00) the US retail sales volume;
- Tomorrow at 09:00 (GMT +3:00) the UK consumer price index (CPI) for last month.
EUR/USD
Technical analysis of the EUR/USD pair suggests a potential corrective rise towards 1.0800, provided the "bullish engulfing" pattern formed yesterday is realised. If the price falls below 1.0660, a retest of the April low around 1.0600 is possible. Today, important macroeconomic data from the eurozone is expected:
- At 12:00 (GMT +3:00) the ZEW economic sentiment index for the eurozone;
- At 12:00 (GMT +3:00) the eurozone consumer price index (CPI).
Experts forecast a rise in these indices, which may support the strengthening of EUR/USD.
Also important for EUR/USD pricing will be the scheduled speech by the Vice-President of the European Central Bank, Luis de Guindos, at 16:30 (GMT +3:00).
Trade over 50 forex markets 24 hours a day with FXOpen. Take advantage of low commissions, deep liquidity, and spreads from 0.0 pips. Open your FXOpen account now or learn more about trading forex with FXOpen.
This article represents the opinion of the Companies operating under the FXOpen brand only. It is not to be construed as an offer, solicitation, or recommendation with respect to products and services provided by the Companies operating under the FXOpen brand, nor is it to be considered financial advice.
GBP/JPY Daily Outlook
Daily Pivots: (S1) 199.46; (P) 199.96; (R1) 200.86; More...
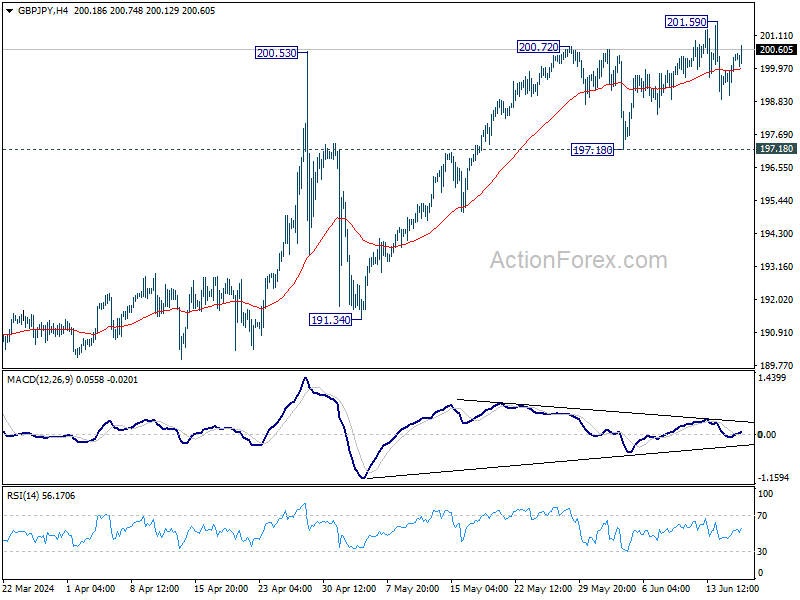
Intraday bias in GBP/JPY stays neutral for consolidations below 201.59. Further rally is expected as long as 197.18 support holds. However, considering bearish divergence condition in 4H MACD, firm break of 197.18 will confirm short term topping, and turn bias back to the downside for 191.34 support instead.
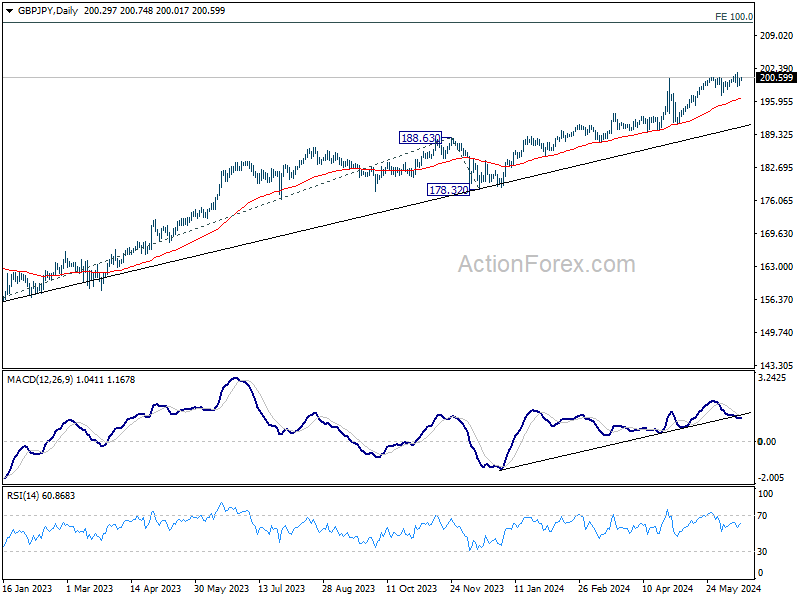
In the bigger picture, as long as 188.63 resistance turned support holds, long term up trend is expected to continue. Next target is 100% projection of 155.33 to 188.63 from 178.32 at 211.62.
EUR/JPY Daily Outlook
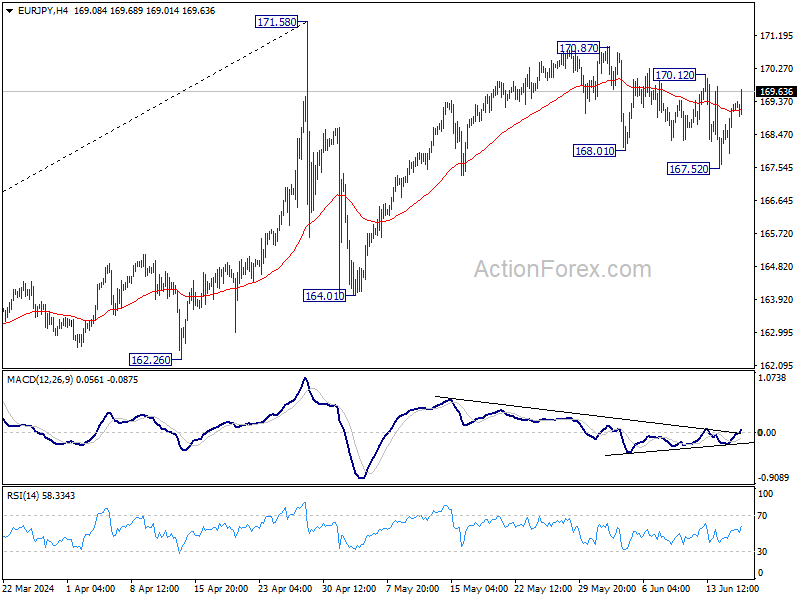
Daily Pivots: (S1) 168.38; (P) 168.86; (R1) 169.76; More...
Intraday bias in EUR/JPY is turned neutral with current strong rebound. On the upside break of 170.12 resistance will argue that pull back from 170.87 has completed at167.52, after drawing support from 55 D EMA. Intraday bias will be back on the upside for 170.87 and then 171.58 high.
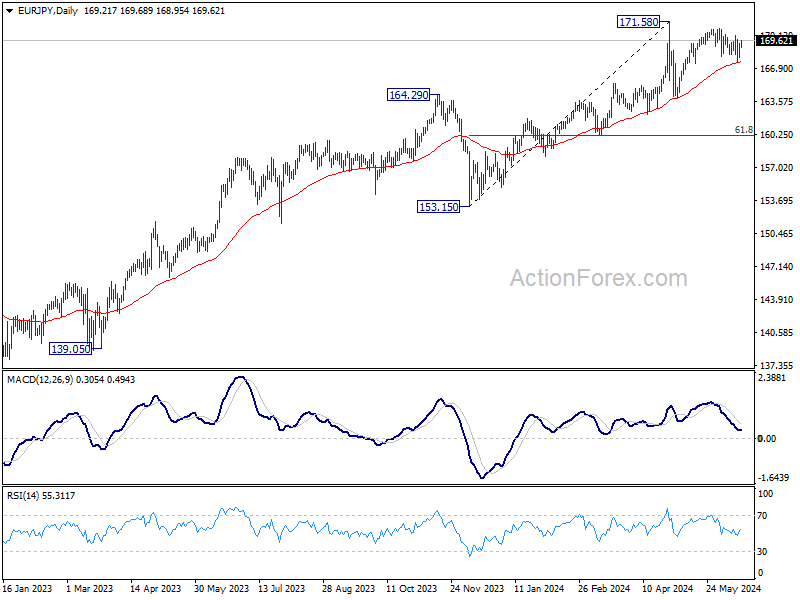
In the bigger picture, as long as 55 W EMA (now at 159.83) holds, price actions from 171.58 medium term top are seen as as correcting the rise from 153.15 only. That is, larger up trend remains in favor to continue as a later stage. However, sustained break of 55 W EMA will argue that larger scale correction is underway and target 153.15 support.
EUR/GBP Daily Outlook
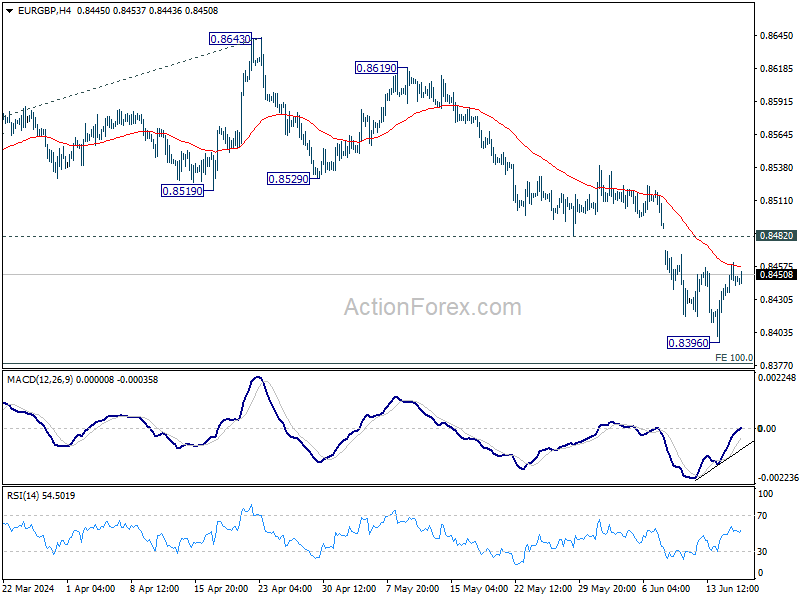
Daily Pivots: (S1) 0.8435; (P) 0.8448; (R1) 0.8463; More...
EUR/GBP is staying in consolidation above 0.8396 and intraday bias stays neutral. Outlook But outlook will remain bearish as long as 0.8482 support turned resistance holds. Below 0.8396 will resume larger down trend to 0.8376 projection level next.
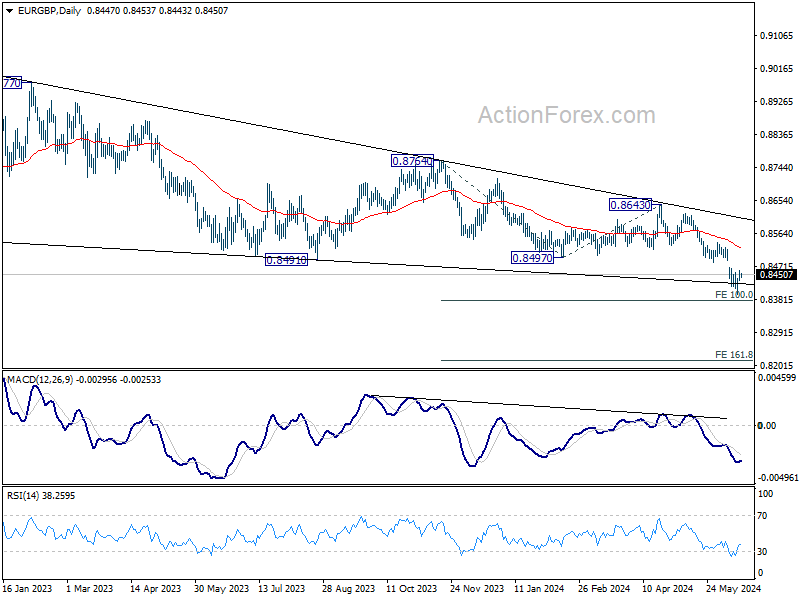
In the bigger picture, down trend from 0.9267 (2022 high) is in progress. Next target is 100% projection of 0.8764 to 0.8497 from 0.8643 at 0.8376. Sustained break there will target 161.8% projection at 0.8211 next. For now, outlook will remain bearish as long as 0.8643 resistance holds, even in case of stronger rebound.
EUR/AUD Daily Outlook
Daily Pivots: (S1) 1.6173; (P) 1.6218; (R1) 1.6278; More...
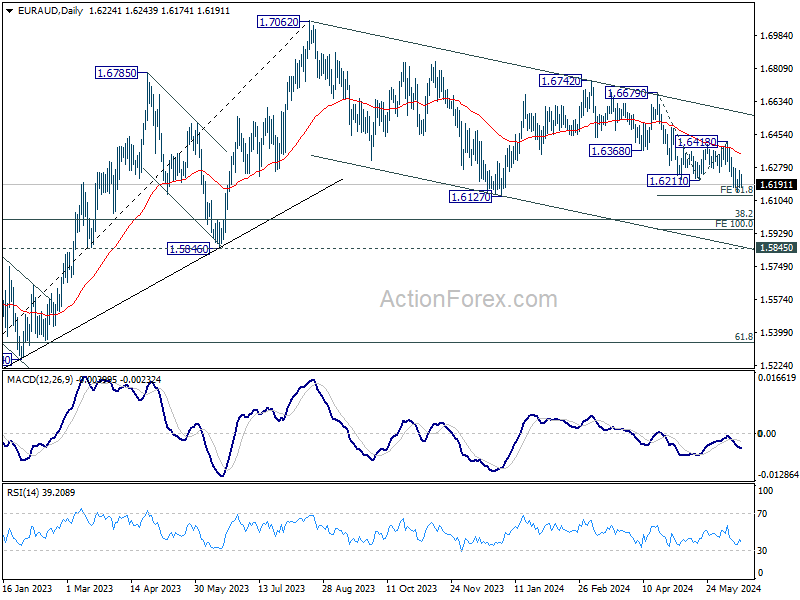
Intraday bias in EUR/AUD remains neutral for consolidations above 1.6148 temporary low. Outlook will stay bearish as long as 1.6418 resistance holds. Firm break of 61.8% projection of 1.6679 to 1.6211 from 1.6418 at 1.6129 will pave the way to 100% projection at 1.5950.
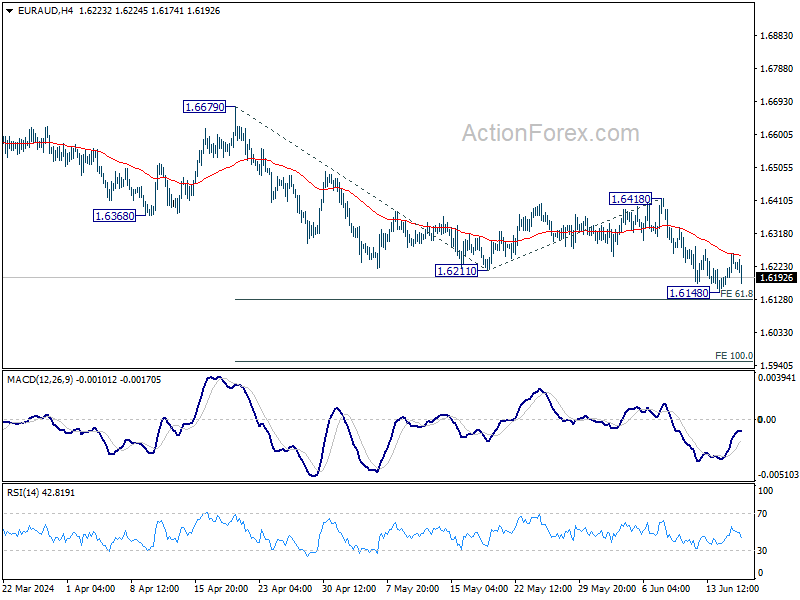
In the bigger picture, fall from 1.7062 medium term top is seen as a correction to the up trend from 1.4281 (2022 low). In case of deeper fall, strong support is expected around 1.5846 and 38.2% retracement of 1.4281 to 1.7062 at 1.6000 to bring rebound. Break of 1.7062 is in favor as a later stage.