
Sample Category Title
June FOMC: Sitting, Waiting, Wishing
Summary
- As expected, the Federal Open Market Committee left the federal funds rate target range unchanged at 5.25-5.50% at the conclusion of its meeting today. Yet the latest Summary of Economic Projections showed most participants continue to expect at least some reduction in the fed funds rate before the year is out.
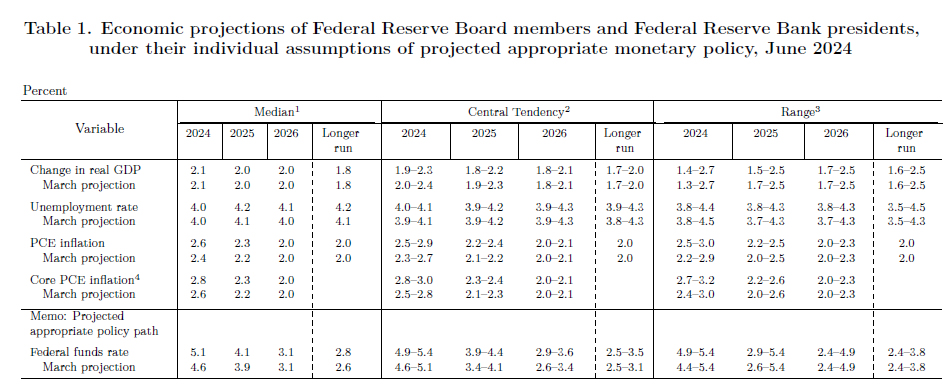
- The median projection for the fed funds rate at year-end was raised to 5.125% from 4.625% in the March SEP, implying only one 25 bps cut before the year. However, the distribution of projections skewed toward more easing, with eight participants expecting two cuts and only four expecting rates to remain unchanged. Participants now see 100 bps of easing over 2025 compared to 75 bps in the prior SEP, which would leave the fed funds target at 4.125%.
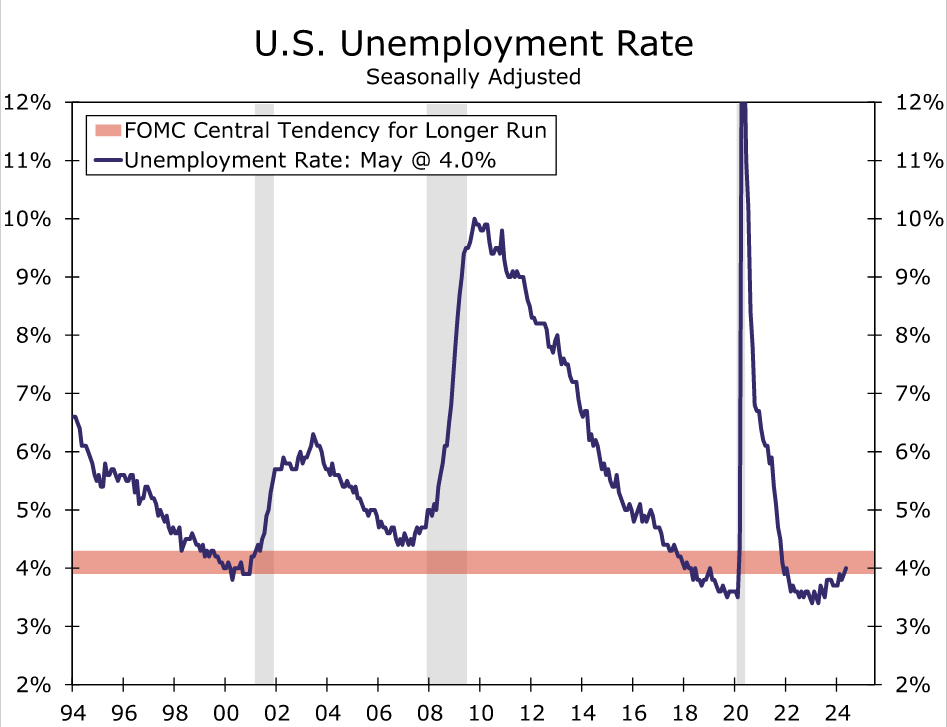
- The delayed start to rate cuts comes as inflation has been stickier this year while economic activity remains "solid." Participants now see core PCE inflation up 2.8% on a Q4/Q4 basis compared to 2.6% in the March SEP, but GDP growth unchanged at 2.1%—above the Committee's median estimate of potential—and the unemployment rate holding at its current rate of 4.0%.
- Changes to the post-meeting statement were minimal. The Committee gave a nod to the somewhat better run of inflation data since its May 1 meeting by noting that there has been some "modest further progress" on the inflation front instead of a "lack of further progress." But, the statement reiterated that inflation remains "elevated" and the FOMC is "strongly committed" to its 2% inflation objective.
- While the May CPI report released earlier today was encouraging for the inflation outlook, the FOMC clearly needs to see more benign prints before a consensus emerges that a reduction in the fed funds rate is warranted. With few signs of that consensus emerging yet, we continue to believe that the earliest the FOMC would reduce the fed funds rate would be at its September 18 meeting, when it will have three more months of inflation and employment data in hand.
- It will be a close call between one or two 25 bps rate cuts, and the Committee seems evenly split between the two outcomes. Our base case forecast since early April has looked for a 25 bps rate cut at each of the September and December FOMC meetings. For now, our forecast remains two cuts this year and another 100 bps of easing in 2025. We will publish our standard monthly economic forecast update on Friday morning.
FOMC Still Playing the Waiting Game
As was universally expected, the Federal Open Market Committee voted unanimously to keep the target range for the fed funds rate unchanged at 5.25-5.50% at the conclusion of its meeting today. With inflation remaining elevated and economic growth still sturdy, the Committee has now held the fed funds rate steady for seven consecutive meetings. Yet an update to the Summary of Economic Projections (SEP) showed that most FOMC participants continue to expect at least some reduction in the fed funds target before the year is out.
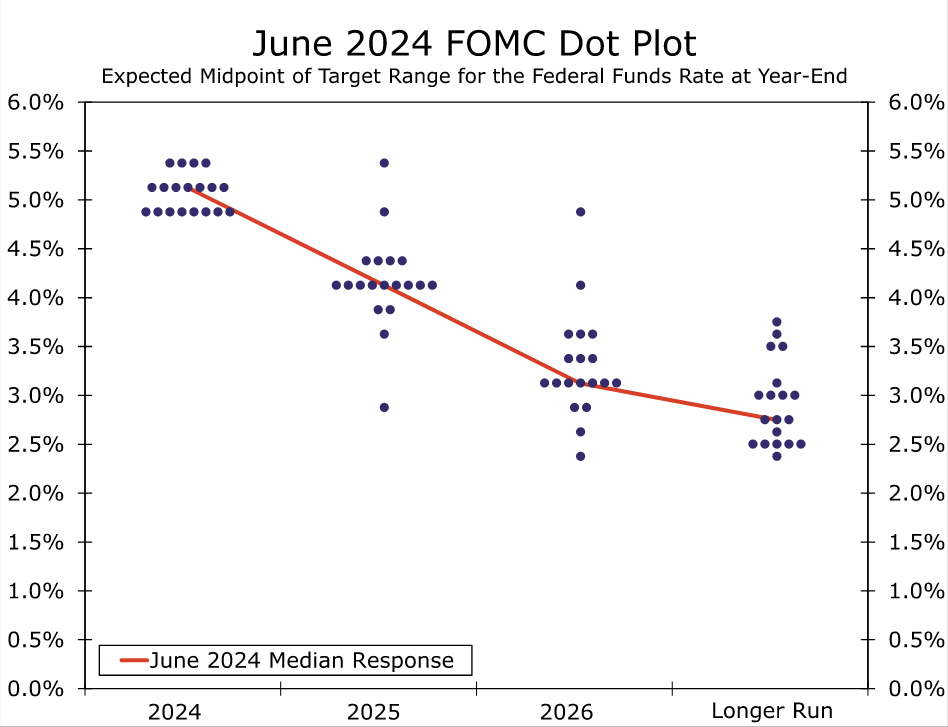
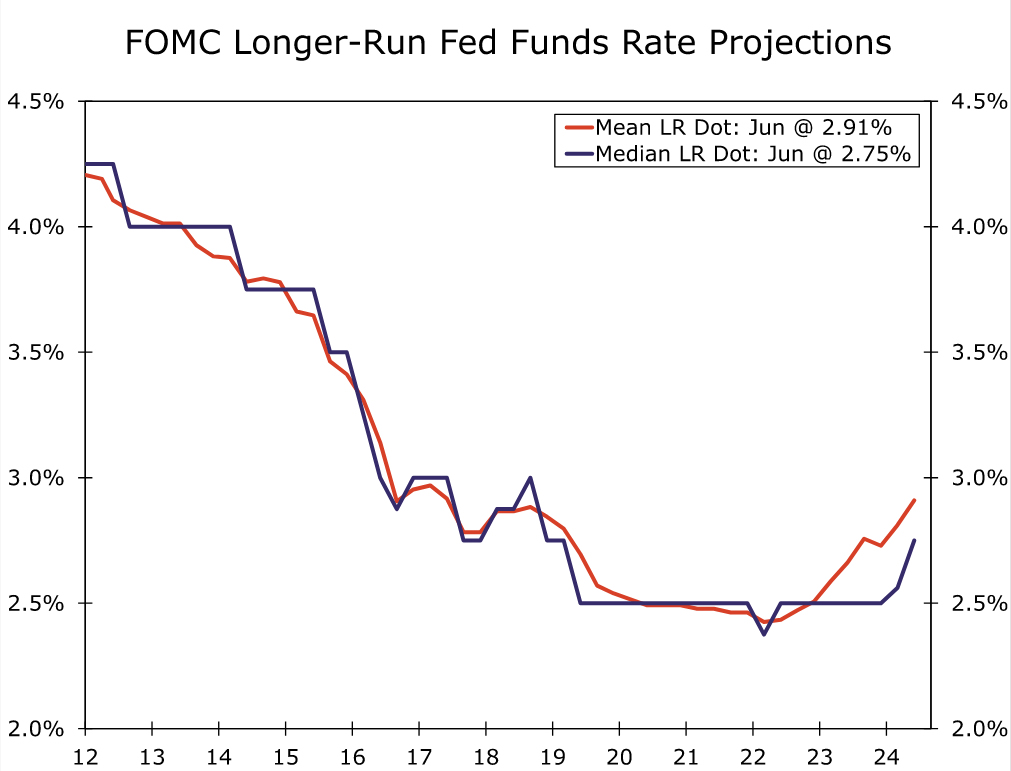
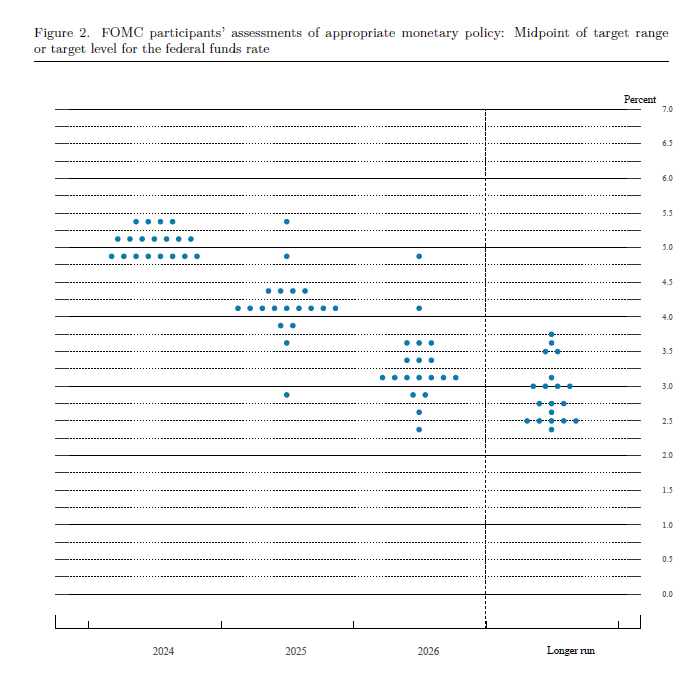
The median Committee participant penciled in one 25 bps rate cut by year-end, down from 75 bps projected in the March SEP. The distribution of the 2024 dots had a clear downward bias. Eight participants anticipated 50 bps of easing by year-end, while just four participants expected the fed funds rate to be unchanged through the end of this year (Figure 1). No participants projected the fed funds rate would rise later this year. Looking to 2025, the median dot is 4.125%, which if realized would be 100 bps of easing in addition to the 25 bps expected this year. The median longer-run dot continued to tick higher, climbing to 2.75%, the highest reading since March 2019 (Figure 2).
Elsewhere, there were few notable changes in the SEP. The median projections for real GDP growth were completely unchanged, while the median projections for the unemployment rate ticked higher by a tenth in 2025 and 2026 in what was likely a nod to the gradual upward trend in the unemployment rate (Figure 3). Headline and core PCE inflation projections were higher by two tenths in 2024 and one tenth in 2025, in line with our expectations headed into the meeting. Participants had the opportunity to adjust their projections in light of this morning's CPI report, although they did not have to make changes, and some may have elected not to given that the May data for the PCE deflator remain uncertain. Powell shared in the press conference that "most" officials do not update SEP submissions on days like this.
Back in December, the median Committee member was expecting 2.4% core PCE inflation and 75 bps of rate cuts in 2024. Today's projections look for 2.8% core PCE inflation this year and just 25 bps of cuts. The downward trend in inflation remains in place, but the bumpy path and slow-going and have led the FOMC to be more patient at this stage of the cycle.
There was only one material change to the post-meeting statement. The statement now gives a nod to the somewhat improved inflation picture since the Committee's May 1 meeting. Instead of noting that there has been a "lack of further progress" toward the Committee's 2% inflation goal, the FOMC recognized "modest further progress" in lowering inflation. Other than that, the only other change in the statement was the removal of the Committee's announcement to slow the pace of quantitative tightening, a process that began on June 1.
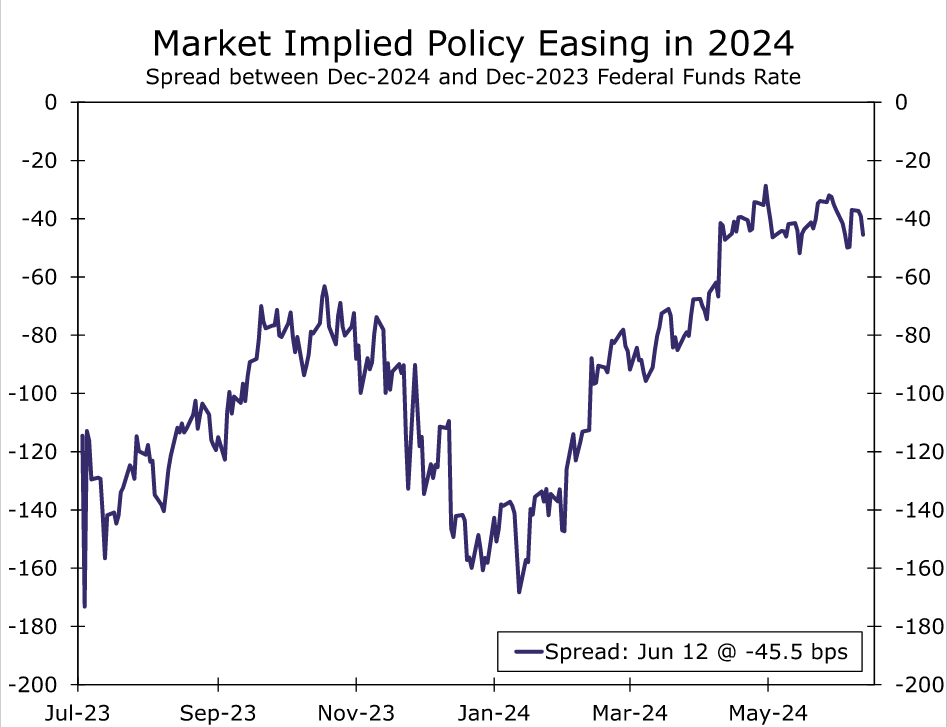
On balance, we remain confident that the FOMC will begin reducing the federal funds rate before the year is out. As we wrote in response to this morning's CPI report, we see inflation pressures continuing to subside as the year progresses. It will be a close call between one or two 25 bps rate cuts, and the Committee seems evenly split between the two outcomes. Financial market pricing also suggests a clear openness to more than one cut this year (Figure 4). Our base case forecast since early April has looked for a 25 bps rate cuts at each of the September and December FOMC meetings. For now, our forecast remains two cuts this year and another 100 bps of easing in 2025. We will publish our standard monthly economic forecast update on Friday morning.
FOMC projects one rate cut this year, no member expects another hike
Fed left interest rates unchanged at 5.25-5.50% as widely expected. The new economic projections are slightly on the hawkish side, indicating that the majority of FOMC expects only one rate cut this year. The neutral rate was also raised. But investors could be relieved that no FOMC member expects any more rate hike.
In the latest median projections, federal funds rate forecast was raised from 4.6% to 5.1% by the end of 2024, indicating only one rate cut fro current level. Federal funds rate is projected to fall to 4.1% (prior 3.9%) by the end of 2025, and 3.1% (unchanged_) by the end of 2026. Additionally, the longer run interest rate was raised from 2.6% to 2.8%, indicating a higher neutral rate.
GDP growth forecasts were left unchanged at 2.1% in 204, 2.0% in 2025 and 2.0% in 2026. Headline PCE inflation was raised to 2.6% (up from 2.4%) in 2024, raised to 2.3% (up from 2.2%) in 2025, and left unchanged at 2.0% in 2026. Core PCE inflation forecast was also raised to 2.8% (up from 2.6%) in 2024, raised to 2.3% (up from 2.2%) in 2025, and left unchanged at 2.0% in 2026.
In the new dot plot, no policymaker makers expect any more rate hike. Four expects interest rate to stay unchanged at 5.25-5.50% through 2024 while seven expect one rate cut to 5.00-5.25%. Eight members project two rate cuts to 4.75-5.25% this year.
(FED) Federal Reserve Issues FOMC Statement
Recent indicators suggest that economic activity has continued to expand at a solid pace. Job gains have remained strong, and the unemployment rate has remained low. Inflation has eased over the past year but remains elevated. In recent months, there has been modest further progress toward the Committee's 2 percent inflation objective.
The Committee seeks to achieve maximum employment and inflation at the rate of 2 percent over the longer run. The Committee judges that the risks to achieving its employment and inflation goals have moved toward better balance over the past year. The economic outlook is uncertain, and the Committee remains highly attentive to inflation risks.
In support of its goals, the Committee decided to maintain the target range for the federal funds rate at 5-1/4 to 5-1/2 percent. In considering any adjustments to the target range for the federal funds rate, the Committee will carefully assess incoming data, the evolving outlook, and the balance of risks. The Committee does not expect it will be appropriate to reduce the target range until it has gained greater confidence that inflation is moving sustainably toward 2 percent. In addition, the Committee will continue reducing its holdings of Treasury securities and agency debt and agency mortgage‑backed securities. The Committee is strongly committed to returning inflation to its 2 percent objective.
In assessing the appropriate stance of monetary policy, the Committee will continue to monitor the implications of incoming information for the economic outlook. The Committee would be prepared to adjust the stance of monetary policy as appropriate if risks emerge that could impede the attainment of the Committee's goals. The Committee's assessments will take into account a wide range of information, including readings on labor market conditions, inflation pressures and inflation expectations, and financial and international developments.
Voting for the monetary policy action were Jerome H. Powell, Chair; John C. Williams, Vice Chair; Thomas I. Barkin; Michael S. Barr; Raphael W. Bostic; Michelle W. Bowman; Lisa D. Cook; Mary C. Daly; Philip N. Jefferson; Adriana D. Kugler; Loretta J. Mester; and Christopher J. Waller.
AUD/USD: Australian Dollar Rallies 1.35% as US Inflation Eases Below Expectations
Australian dollar was one of the top gainers among major currencies on Wednesday, after weaker than expected US CPI data revived hopes disinflation is back to play and added to doves advocating for September Fed rate cut.
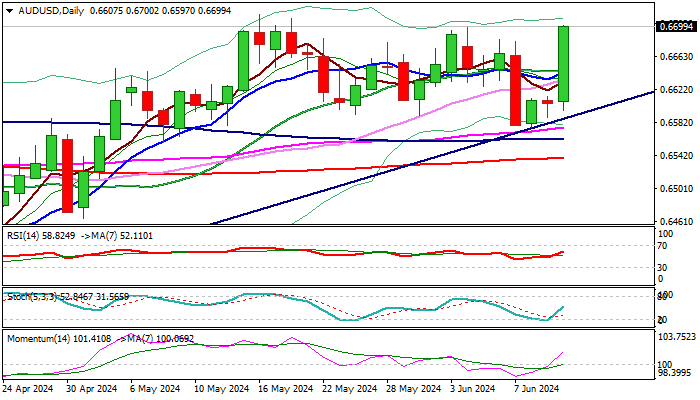
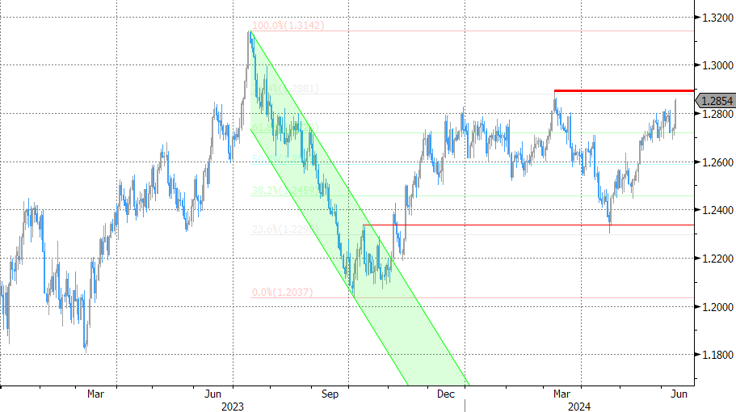
AUDUSD pair advanced 1.35% after release of data and cracked 0.6700 barrier, nearing full retracement of 0.6714/0.6575 pullback (the barrier is reinforced by the top of weekly Ichimoku cloud), and likely to provide headwinds for fresh bulls.
Structure on daily chart has turned to full bullish mode and north-heading indicators show more room for extension higher.
Firm break of 0.6714 pivot to confirm a higher base at 0.6580 zone and signal continuation of an uptrend from 0.6362 (Apr 19 low) towards next targets at 0.6750 (Fibo 76.4% of 0.6871/0.6362 downtrend) and 0.6800 (psychological) in extension.
Dips should be limited and provide better levels to re-enter bullish market, but strong warning could be expected on drop below converged daily Tenkan/Kijun-sen lines (0.6638/36).
Markets shift focus towards Fed’s comments at the end of two-day policy meeting, due later today.
The US central bank is expected to keep its monetary policy unchanged, and markets will closely watch Fed’s projections (dot plots) for fresh signals about the timing and the pace of policy easing, in new reality after surprise drop in consumer prices in May.
The Aussie may rally further if the US policymakers take more dovish stance, which should be anticipated in current condition after encouraging news for the US policymakers.
Res: 0.6714; 0.6728; 0.6750; 0.6800
Sup: 0.6676; 0.6636; 0.6616; 0.6580
After Macron’s Election Gamble, Is Political Risk a New Headwind for the Euro?
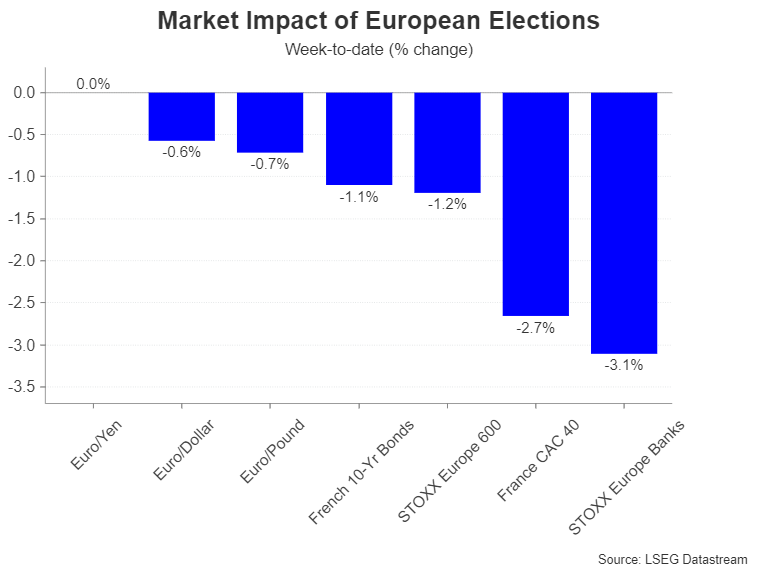
- Snap elections in France spur panic in euro and French stock market
- Doubts about Germany’s coalition add to euro’s woes
- Is political instability about to become a persistent risk for the euro?
Europe steers to the right
Financial markets don’t usually pay so much attention to elections for the European Parliament, as national governments are often seen as the bigger force in setting EU policy. However, whilst the outcome of far-right parties faring well was widely predicted, it is the fallout in France, and potentially in Germany too, that is having ripple effects in the markets.
President Macron’s Ensemble coalition, made up of liberal-centrist parties, received just 14.6% of the votes, coming second to Marie Le Pen’s National Rally party, which won more than twice that share, gaining 31.4%. When combined with the votes for the smaller Reconquete Party, the share of the far right rises to just under 37%.
Snap elections: brave or foolish?
This must have been enough to ring alarm bells for Emmanuell Macron, who decided on Monday to call a snap election, catching his political opponents as well as his own party completely by surprise. Yet, having lost his parliamentary majority in the previous legislative elections in 2022, a snap election is a huge gamble, as his alliance runs the risk of losing even more seats.
Although it’s unlikely that Le Pen’s party will win as many votes in national elections, it is currently ahead in the polls, with Macron’s Ensemble third behind the left-wing alliance. If Macron’s gamble doesn’t pay off and his alliance comes out weaker, the likely outcome is a “cohabitation” whereby parties not affiliated to the president would form the government. The pick of prime minister would still be up to the president in such a scenario, but Macron would have no choice but to appoint someone from rival parties, making him a lame duck president less than halfway through his term.
Running out of allies
Complicating matters for Macron is the chaos within the centre-right Les Republicains party – the most obvious choice to partner with to keep the far-right out of power. Its leader has called for an alliance with the far-right National Rally to the horror of other senior figures within Les Republicains. While in another setback, left-wing parties made up of socialists, communists and the Greens have just announced a new pact, further diminishing Macron’s options for possible coalition partners.
With France in danger of plunging into political turmoil, the elections couldn’t have come at a worse time for Europe. Germany – the other half of the Franco-German political engine that drives EU integration – is also on the brink of a political crisis. Chancellor Olaf Scholz’s Social Democrats came third in the European elections, with the coalition hanging by a thread.
Change might not be a bad thing
Germany’s coalition government, which also includes the Greens and the Free Democrats, has been under strain for some time, while relations between Macron and Scholz have been uneasy at best. Thus, political change in either Paris or Berlin, or both, might not necessarily turn out to be so disastrous.
Yes, the threat of far-right parties gaining more influence in both France and Germany doesn’t bode well for further European integration. But it’s worth remembering that Italy is currently being run by a far-right government and that hasn’t led to radical policies that would spook the markets. If anything, Georgia Meloni’s government has brought some rare stability in Rome. Moreover, despite the upsets, centrists held their ground in the European Parliament.
Euro skids, but not much
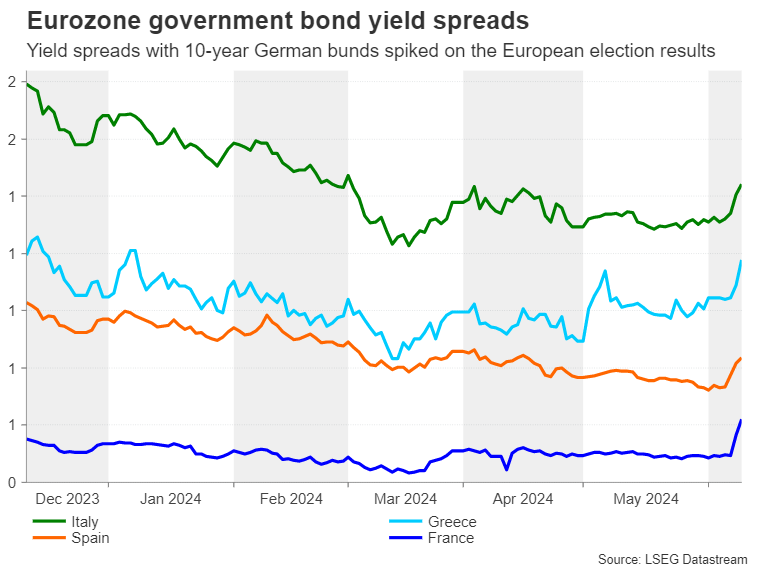
However, traders aren’t so convinced, and French government bond yields have surged in the aftermath of the election fallout. Italian yields also spiked, though the moves in safe-haven German bunds were more muted. The euro, meanwhile, has come under significant pressure, but its weekly losses are less than 1% and look exaggerated as it came after Friday’s slump on the back of the strong US jobs report.
 Still, with France’s elections not due until June 30, which will be followed by a run-off vote on July 7, the elevated political uncertainty will likely keep the euro heavy at least until then. The question is, would the worst-case scenario of a far-right majority in France and snap elections being called in Germany too change much for the European Union?
A bumpy road ahead amid uncertainties
The answer is probably no. But markets may have woken up to the possibility of a permanent shift in Europe’s political landscape and that brings with it a number of uncertainties over the longer term. In France, the prospect of a Le Pen government is already causing angst for local traders, with the CAC 40 index taking the brunt of the selloff. Investors are worried about the risk to the economy from interventionist policies should far-right parties win power.
 For the single currency, the problem isn’t so much the actual composition of national governments but the lack of strong champions for deeper political union in Europe, as well as the political will to carry out some much-needed reforms.
Nevertheless, with the debate to start soon on whether to reappoint Ursula von der Leyen as President of the EU Commission and the ongoing uncertainty about the monetary policy paths in both the US and the Eurozone, the summer period may be a bumpy one for the euro.
Sunset Market Commentary
Markets
US May CPI numbers served as an appetizer going into tonight’s FOMC meeting. Both headline (flat) and core (+0.2% m/m) inflation missed expectations for a 0.1% and 0.3% rise respectively. That resulted in slower y/y readings of 3.3% and 3.4% with the latter the lowest since April 2021. Airline fares (-3.6%), transportation (-1.1%) and energy (-2%) were a drag, offsetting still-solid price pressures in shelter (0.4%). Services rose by 0.2% (5.2% y/y), the slowest pace since September 2021. The supercore gauge (core services ex housing) turned negative (-0.04%), lowering the annualized 3m rolling average from 6.34% to 4.20%. US markets reacted with a sharp drop in yields. The front end loses up to 16 bps. German yields got caught in the slipstream (between 6.6 and 8.4 bps lower). Money market implied probability for a September Fed rate cut grew from 58% to >80% with a cumulative 50 bps of cuts priced in by the end of the year. Barring one occasion mid-May, it’s the first time since early April that markets are again fully discounting two 25 bps cuts this year. The US dollar suffered a serious setback against a euro that got some reprieve from markets for the first time this week. EUR/USD jumps from 1.072 to 1.0836. DXY erases much of the gains since last Friday (payrolls) to trade around 104.42 currently. In a broader sign of European assets breathing a sigh of relief, equities in the region trade in the green, even if it shows France’s index (+0.9%) underperforming peers a bit. The 10-yr OAT/swapspread to does eke out a tiny rise though, contrasting with semi-core peers including Belgium.
Turning to the Fed now. With currently two cuts fully priced in, a change in the dot plot from three to two cuts in 2024 won’t affect markets much. The expected 2025 projection of 3x25 bps on the other hand would come in slightly more hawkish than what markets currently anticipate (between three and four). The tone of chair Powell during the presser is a wildcard. He’ll welcome today’s benign inflation number after a string of disappointments but it’s just one of the couple of months the Fed probably wants to see. Friday’s payrolls have something in store for both parties. Strong employment and wage growth hangs in the balance with an unexpected uptick in the unemployment rate, to which the chair proved sensitive too. And even a strong services ISM could be downplayed by a manufacturing gauge venturing deeper in contraction territory. Markets’ reaction to an all in all minor downside CPI surprise follows after weeks of aggressive/hawkish repricing and suggests particular vulnerability to a dovish chair.
News & Views
The International Energy Agency published the latest edition of its annual medium-term oil market report. They expect total supply capacity to rise to nearly 114 mn barrels/day by 2030, which would be a staggering 8mn barrels/day above projected global demand. This would result in levels of spare capacity never seen before other than at the height of the Covid-19 lockdowns in 2020. Producers outside of OPEC+ are leading the expansion of global production capacity. The US alone is poised to account for 2.1mn barrels/day while Argentina, Brazil, Canada and Guyana contribute another 2.7mn. Global oil demand is set to reach a peak by the end of the decade (+3.2mn barrels/day compared to 2023) mainly because of strong demand from fast-growing countries in Asia as well as from the aviation and petrochemicals sectors. Offsetting factors include rising electric car sales, declining use for electricity generation in the Middle East and structural economic shifts. Despite this outlook, Brent crude extends this month’s rebound, rising from $82/b to $83/b.
Greece announced that it will repay a total amount of €8bn in bailout loans ahead of schedule. It’s the third time that they do such early repayment. It covers loan amortizations from 2026 to 2028 under the Greek Loan Facility. The lion share (€5bn) comes from the cash buffer built up during the crisis years, when Greece was cut off or had limited access to market funding. Simultaneously the Greek center-right government recently used positive momentum to proceed with some privatization initiatives. PM Mitsotakis pointed to real appetite for Greek assets as the market seems to believe the long-term goal story and the stable government is there to stay. Greece last year regained investment graded ratings at Moody’s and S&P. The Greek debt ratio fell from a 207% of GDP high in 2020 to 153% (expected) this year.
Graphs
US 2-yr yield tanks to new recent lows after minor CPI miss brings two rate cuts in 2024 back in focus
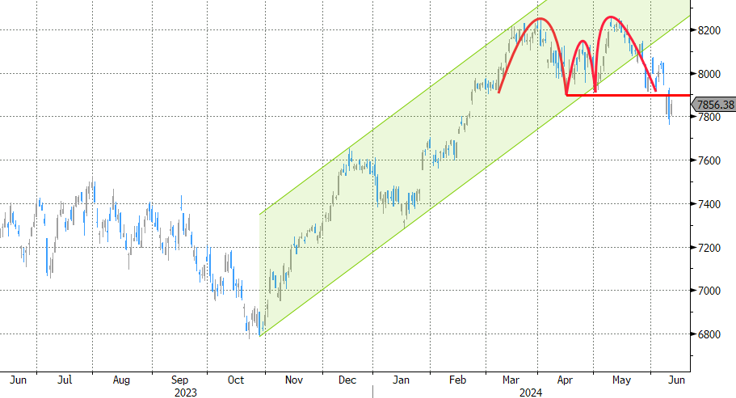
CAC40: French stock index is looking for a bottom after president Macron triggered sell-off
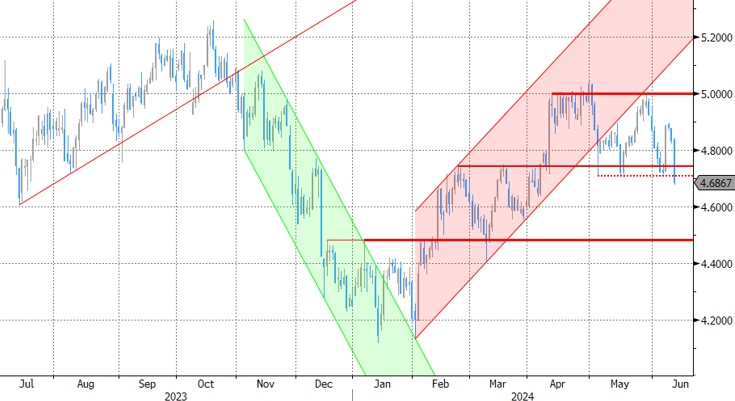
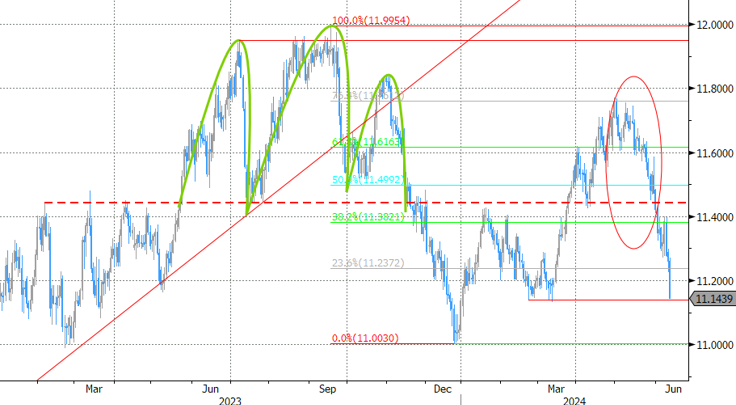
EUR/SEK: Swedish crown extends its recent bull run as global core bond yields decline sharply today
Dollar-hit hurls GBP/USD towards current YtD highs
EURUSD Recoups Losses and Bearish Gap after US CPI
- EURUSD posts gains above 1.0800
- RSI crosses above 50 level
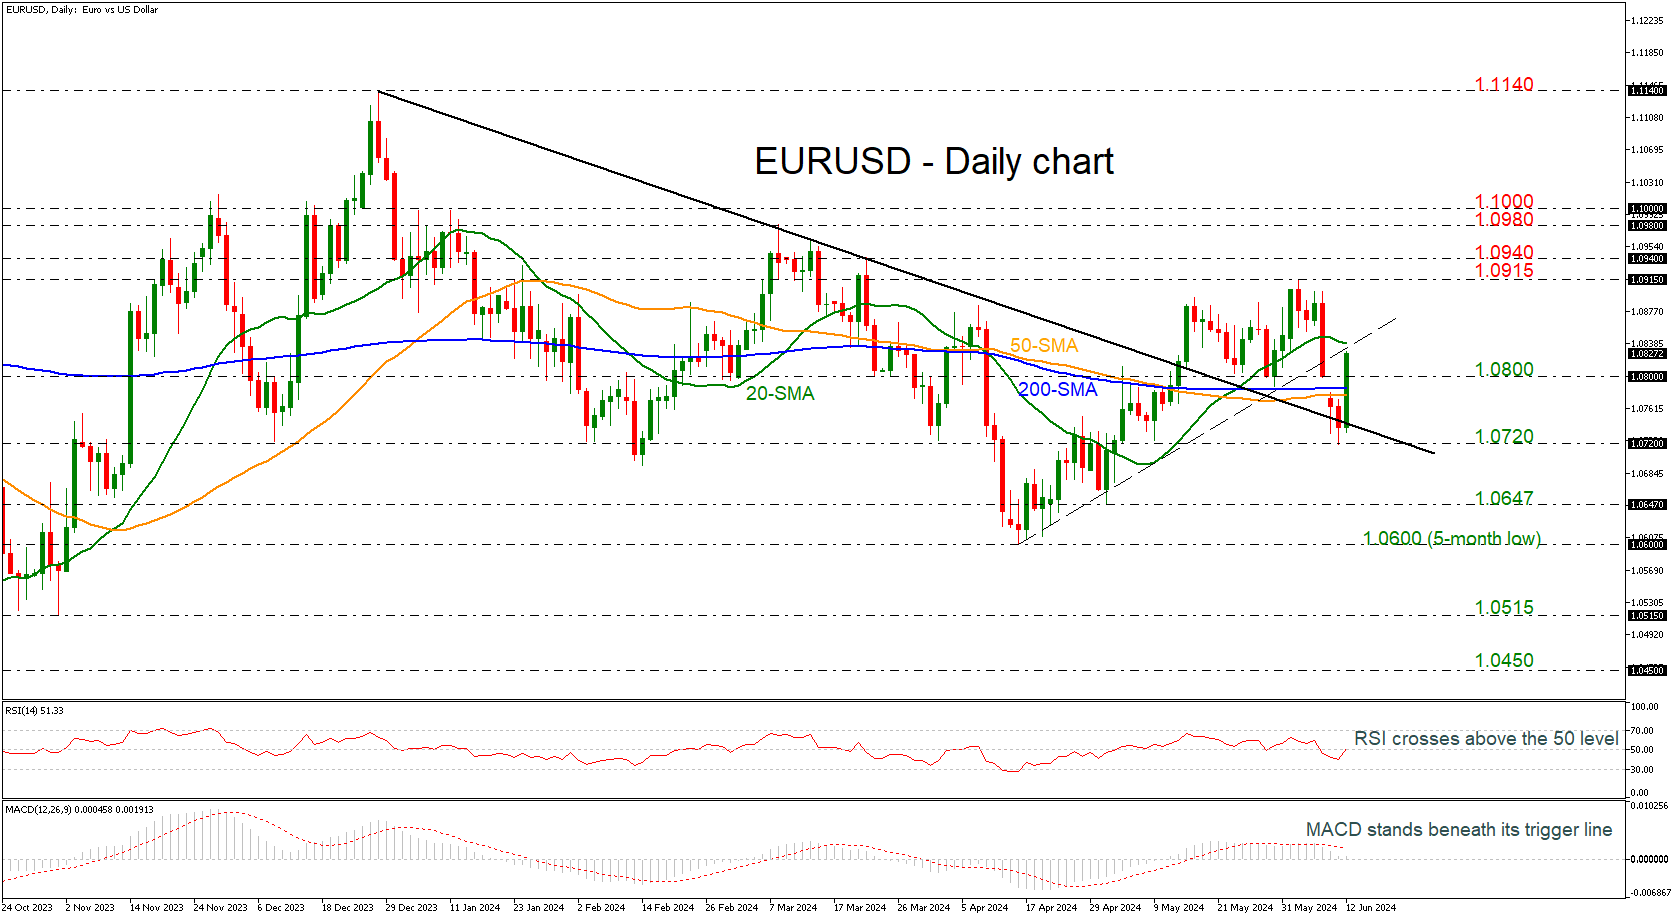
EURUSD is extending its rebound off 1.0740 after US inflation data that was lower than expected. The pair jumped above the 50- and the 200-day simple moving averages (SMAs) as well as the 1.0800 round number.
Technically, the RSI indicator is currently crossing the 50 level to the upside; however, the MACD is losing momentum beneath its trigger line and near the zero level.
In case buyers hold control and pierce above the short-term uptrend line and the 20-day SMA at 1.0840 that would bring the price towards the 1.0915-1.0940 resistance region. Even higher, the levels to watch would be the 1.0980 barrier and the 1.1000 round number.
On the other hand, if sellers take the upper hand, the first obstacle to the downside might be the 200-day SMA at 1.0785 ahead of the 1.0720 support. A move beneath the medium-term downtrend line could resume the bearish tendency, meeting the 1.0647 zone.
Summarizing, as the price surpassed the 1.0800 level there is potential for an upside recovery; however, a drop back beneath 1.0720 would bring the positive view into doubt.
US Dollar Index: Dollar Falls Sharply on Softer than Expected US May Inflation Numbers
The US dollar fell across the board in immediate reaction to softer than expected US May inflation numbers, which revived hopes for Fed rate cut in September.
US m/m consumer prices were flat in May after 0.3% increase in April and annualized rose by 3.3% last month, compared to 3.4% rise previous month / forecast.
Core CPI, stripped for the most volatile components, was down to 0.2% in May m/m from 0.3% in April and 3.4% y/y from 3.6% previous month.
Softer than expected May figures provided relief to Fed policymakers, who signaled further delay in timing of the first rate cut, boosting bets for the first action by the central bank to be seen in September.
FOMC ends its two day policy meeting later today, with wide expectations to keep rates unchanged, but markets will focus more on the central bank’s projections, which will provide more details about Fed’s steps in coming months.
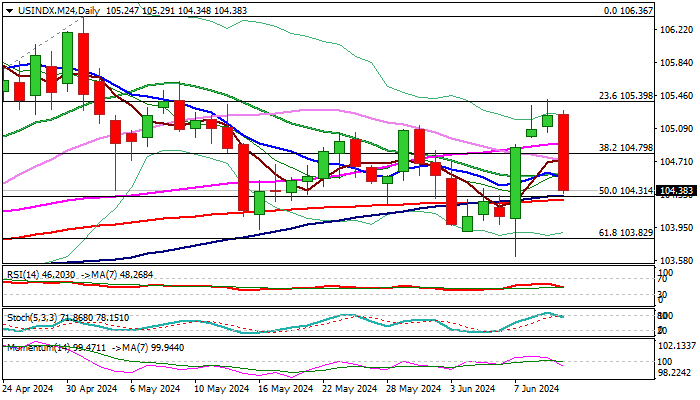
Soft CPI numbers soured dollar’s sentiment and prompted sharp selloff, which pushed the price of dollar index down by 0.6% in the first minutes after the data release.
Fresh drop significantly weakened technical picture, with hourly and 4-h studies becoming firmly bearish, while the structure on daily chart significantly weakened.
Sharp post-data fall already retraced over 50% of 103.61/105.42 upleg, with rising negative momentum and stochastic reversing from overbought territory, generating strong bearish signal on daily chart.
Bears pressure key supports at 104.30 zone (daily cloud base / converged 100/200DMA’s / Fibo 61.8% of 103.61/105.42 rally), with clear break here to validate bearish signal and open way for fresh extension lower (103.90/103.61 are next targets).
However, bears may face increased headwinds here which may spark a partial profit-taking, with limited upticks to be seen as consolidation and positioning for continuation of the bear-leg from 105.42 (Jun 11 peak).
Barriers at 104.70/80 zone should ideally cap upticks and guard upper pivots at 105.00/18 (broken Fibo 50% / daily cloud top).
Res: 104.57; 104.75; 105.00; 105.18.
Sup: 104.30; 103.90; 103.61; 103.22.
US: Inflationary Pressures Cool More Than expected in May
The Consumer Price Index (CPI) was flat in May, coming in below the consensus forecast calling for a modest gain of 0.1% month-on-month (m/m). On a twelve-month basis, CPI edged lower by 0.1 percentage points to 3.3%.
- Energy prices dipped by 2.0% last month, largely due to lower prices at the pump (-3.5% m/m). Food prices ticked higher by 0.1% m/m, and are up 2.1% y/y.
Excluding food & energy, core prices rose a 'soft' 0.2% m/m (0.16% m/m unrounded), also coming in a tick below the consensus forecast and marking a notable deceleration from April's 0.28% m/m gain. Relative to May 2023, core inflation fell to 3.4%.
Core services prices rose a very subdued 0.2% m/m – the weakest monthly gain since December 2021 – and are up 5.3% on a twelve-month basis. Higher shelter costs (+0.4% m/m) were entirely responsible for last month's gain in services prices.
- Meanwhile, non-housing services (i.e., 'supercore') inflation was flat on the month, thanks to a sharp drop in airfares and some pullback in recreational services. Vehicle insurance costs were also lower on the month, but are still up a sizeable 20% y/y. The three-month annualized rate of change on supercore dipped to 4.5% (from 6.4% the month prior).
Goods prices were flat on the month, as a pullback in education & communication goods, apparel and new vehicle prices were largely offset by an uptick in used vehicles and medical goods. .
Key Implications
The May CPI reading delivered a pleasant surprise, coming in handily below the consensus forecast. Importantly, last month's deceleration offers further support that the flare-up in inflationary pressures earlier this year has subsided. The three-month annualized rate of change on core dipped to 3.3% – the slowest pace of growth since December 2023.
The Fed is on tap to make its next interest rate announcement at 2pm ET. While rates are expected to be held steady, the focus will be on the release of the updated Summary of Economic Projections (SEP) as well as Powell’s press conference (starting at 2:30 ET). The March SEP indicated 75 basis points of easing by year-end, but with inflation still elevated and the economy still adding jobs at an impressive rate, the FOMC’s refreshed projections will likely show just 25-50bps of easing by the end of this year. Stay tuned!