Sample Category Title
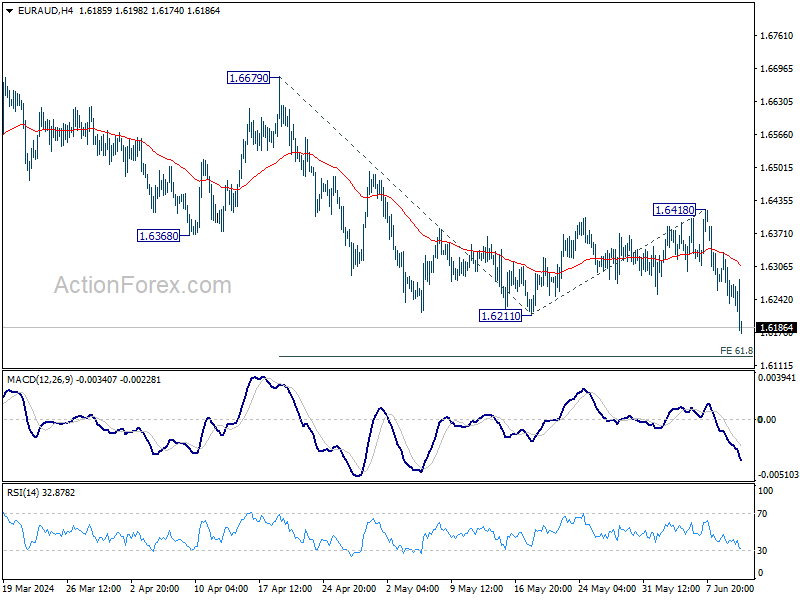
EUR/AUD Mid-Day Outlook
Daily Pivots: (S1) 1.6217; (P) 1.6277; (R1) 1.6318; More...
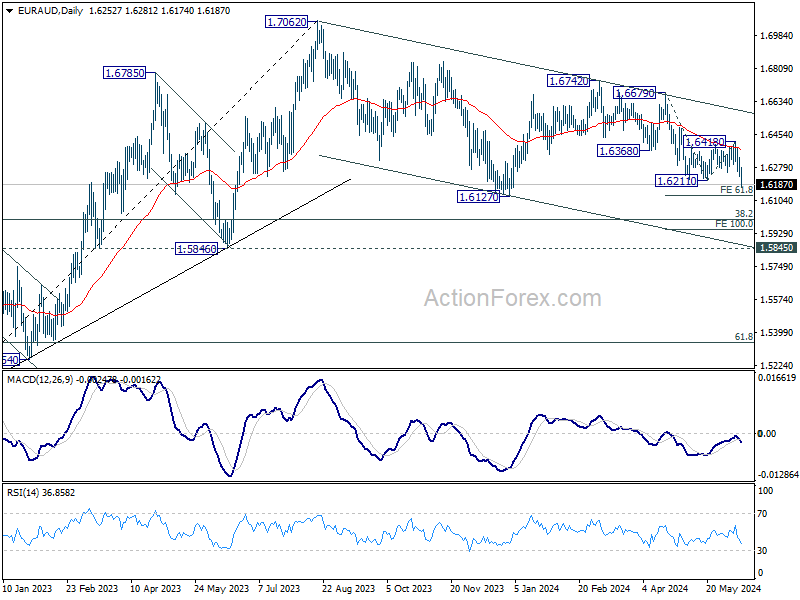
EUR/AUD's break of 1.6211 support confirms resumption of decline from 1.6742, as the third leg of the correction from 1.7062. Intraday bias is now on the downside for 61.8% projection of 1.6679 to 1.6211 from 1.6418 at 1.6129 first. Firm break there will target 100% projection at 1.5950. For now, outlook will stay bearish as long as 1.6418 resistance holds, in case of recovery.
In the bigger picture, fall from 1.7062 medium term top is seen as a correction to the up trend from 1.4281 (2022 low). In case of deeper fall, strong support is expected around 1.5846 and 38.2% retracement of 1.4281 to 1.7062 at 1.6000 to bring rebound. Break of 1.7062 is in favor as a later stage.
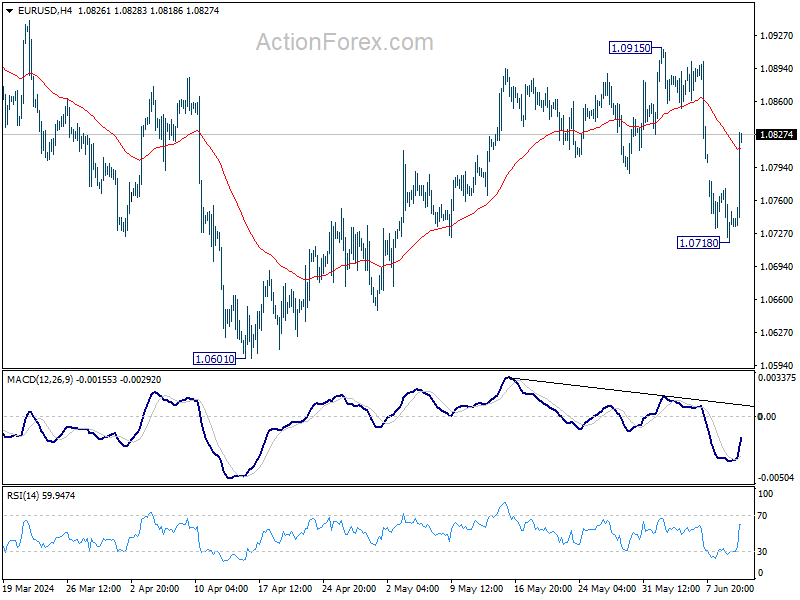
EUR/USD Mid-Day Outlook
Daily Pivots: (S1) 1.0715; (P) 1.0745; (R1) 1.0769; More....
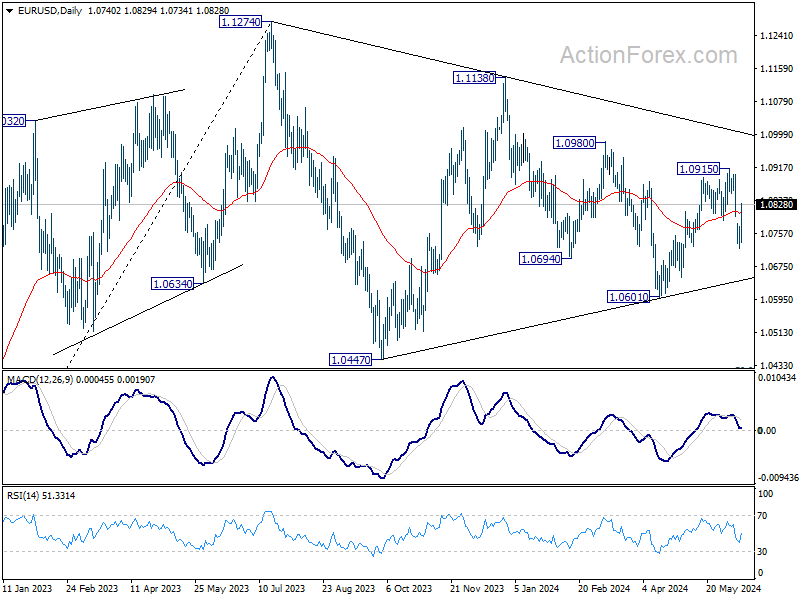
EUR/USD's strong rebound and break of 55 4H EMA (now at 1.0812) argues that pull back form 1.0915 has completed at 1.0718. Intraday bias is back on the upside for 1.0915 resistance first. Firm break there will resume whole rise from 1.0601. On the downside, break of 1.0718 will resume the fall from 1.0915 instead.
In the bigger picture, price actions from 1.1274 are viewed as a corrective pattern, which might still be in progress. Break of 1.0601 will target 1.0447 support and possibly below. Nevertheless, on the upside, firm break of 1.1138 will argue that larger up trend from 0.9534 (2022 low) is ready to resume through 1.1274 high.
USD/CHF Mid-Day Outlook
Daily Pivots: (S1) 0.8955; (P) 0.8974; (R1) 0.8996; More….
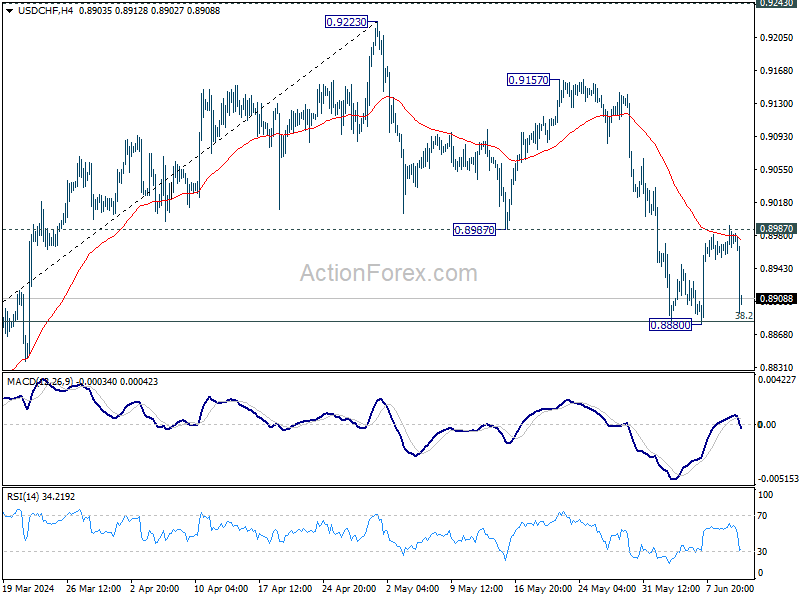
USD/CHF falls sharply after rejection by 0.8987 support turned resistance and 55 4H EMA. But it;s staying above 0.8880/3 support zone so far. Intraday bias remain neutral first. On the downside, sustained break of 0.8883 fibonacci level will carry larger bearish implications and bring deeper decline. On the upside, firm break of 0.8987 support turned resistance will argue that correction from 0.9223 has completed, after drawing support from 0.8883 fibonacci level. Intraday bias will be back on the upside for 0.9157/9223 resistance zone.
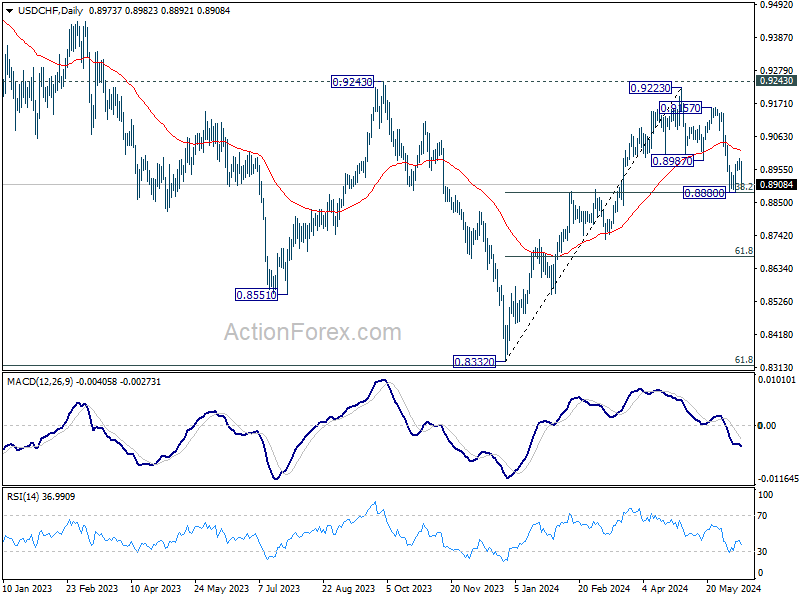
In the bigger picture, price actions from 0.8332 medium term bottom are tentatively seen as developing into a corrective pattern to the down trend from 1.0146 (2022 high). Rejection by 0.9243 resistance, followed by sustained break of 38.2% retracement of 0.8332 to 0.9223 at 0.8883 will strengthen this case, and maintain medium term bearishness. However, decisive break of 0.9243 will argue that the trend has already reversed and turn medium term outlook bullish for 1.0146.
USD/JPY Mid-Day Outlook
Daily Pivots: (S1) 156.83; (P) 157.12; (R1) 157.43; More...
USD/JPY drops sharply in early US session but stays in range of 154.53/157.70 and intraday bias remains neutral first. On the downside, break of 154.53 will turn bias to the downside for 151.86 support and possibly below, as the third leg of the corrective pattern from 160.20. On the upside, break of 157.70 will resume the whole rise from 151.86 and target 160.20 high.

In the bigger picture, a medium term top should be formed at 160.20. As long as 55 W EMA (now at 147.77) holds, fall from 160.20 is seen as correcting the rise from 140.25 only. However, sustained break of 55 W EMA will argue that larger correction is possibly underway, and target 146.47 support next.

GBP/USD Mid-Day Outlook
Daily Pivots: (S1) 1.2713; (P) 1.2732; (R1) 1.2759; More...
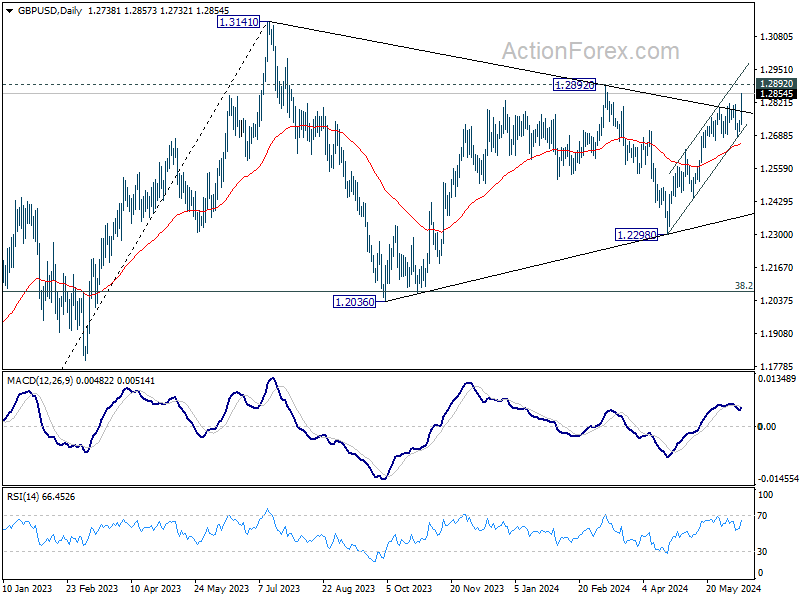
GBP/USD's strong rally and firm break of 1.2816 support confirms resumption of rise from 1.2298. Intraday bias is back on the upside for 1.2892 resistance. Decisive break there will strengthen the case that correction from 1.3141 has completed, and bring further rally to retest this high. On the downside, break of 1.2687 support is needed to indicate short term topping. Otherwise, outlook will stay bullish in case of retreat.
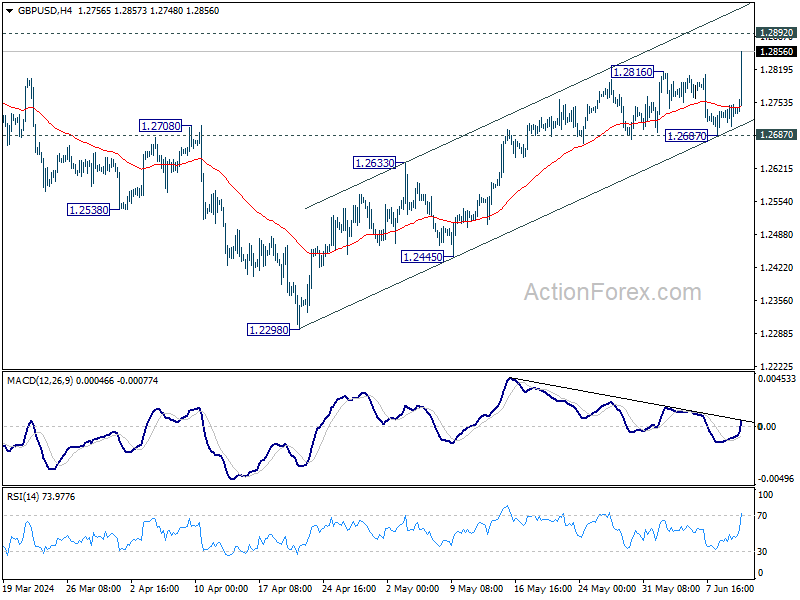
In the bigger picture, price actions from 1.3141 medium term top are seen as a corrective pattern. Fall from 1.2892 is seen as the third leg which might have completed already. Break of 1.2892 resistance will argue that larger up trend from 1.0351(2022 low) is ready to resume through 1.3141. Meanwhile, break of 1.2445 support will extend the corrective pattern with another decline instead.
Dollar Plummets on Softer Inflation Data Ahead of Crucial FOMC Decision
Dollar took a significant hit in early US session, following the release of weaker-than-expected consumer inflation data. A particularly notable point is that headline CPI remained flat for the month, a scenario not seen since November last year. Annual core CPI also continued its steady disinflationary trend. In response to this data, US stock futures jumped, while the yield on the 10-year Treasury note dropped sharply.
This shift in inflation data has set the stage for heightened anticipation around the looming FOMC announcement. While it's widely expected that Fed will hold interest rates steady, the real focus will be on the new economic projections and the updated dot plot. These will provide insights into Fed's outlook on future rate moves. If the projections show that most policymakers anticipate two rate cuts this year, and fewer see the need for another rate hike, Dollar's downward momentum could continue.
Overall in the currency markets, Dollar has become the weakest performer of the week, even more so than the politically troubled Euro. Yen is trailing closely behind Euro as the third weakest currency. On the other hand, New Zealand Dollar and Australian Dollar are showing the most strength, followed by British Pound. Canadian Dollar and Swiss Franc are holding middle positions in terms of performance.
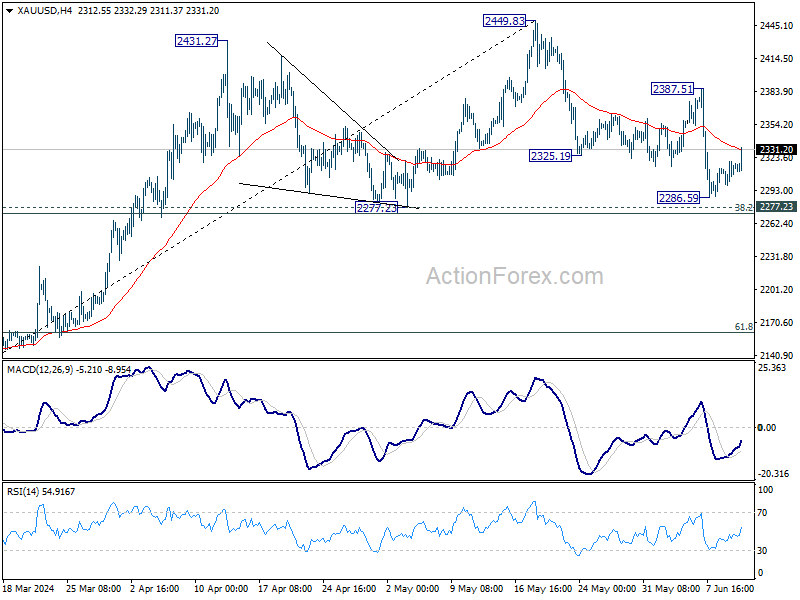
Technically, Gold also jumped on Dollar's sell-off. Sustained trading above 55 4H EMA (now at 2331.01) will argue that correction from 2449.83 has completed with three waves down to 2286.59, after defending 2277.23 cluster support. Further rise should then be seen towards 2387.51. Firm break there will strengthen this bullish case and target 2449.83 high.
In Europe, at the time of writing, FTSE is up 1.06%. DAX is up 1.18%. CAC is up 1.03%. UK 10-year yield is down -0.100 at 4.177. Germany 10-year yield is down -0.069 at 2.565. Earlier in Asia, Nikkei fell -0.66%. Hong Kong HSI fell -1.31%. China Shanghai SSE rose 0.31%. Singapore Strait Times fell -0.05%. Japan 10-year JGB yield fell -0.0273 to 0.989.
US CPI at 0.0% mom, 3.3% yoy in May, below expectations
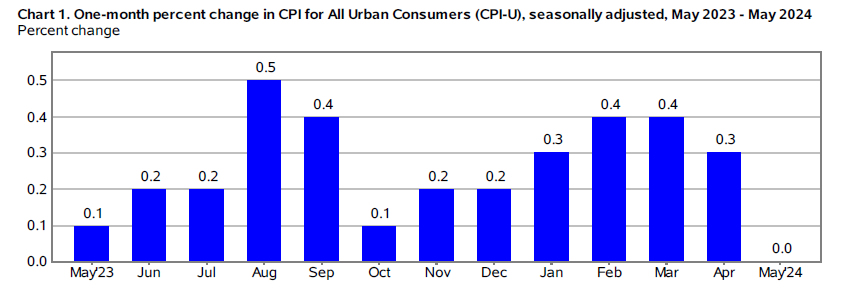
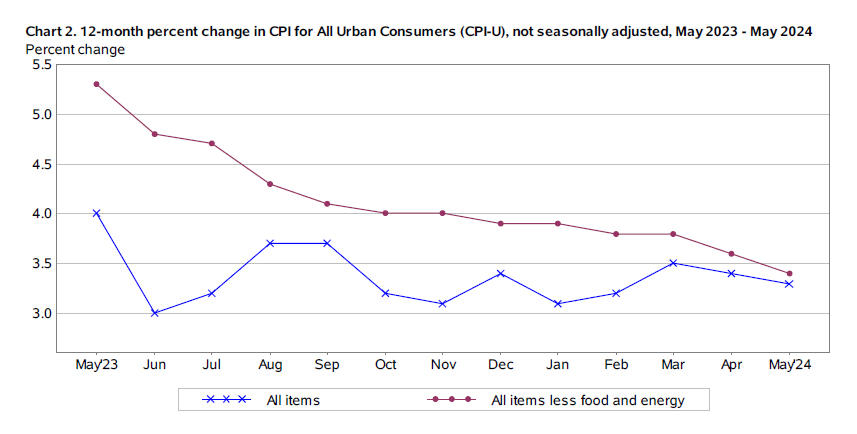
US CPI was flat at 0.0% mom in May below expectation of 0.2% mom. CPI core (all items less food and energy)rose 0.2% mom, below expectation of 0.3% mom. Food prices rose 0.1% mom, while energy prices fell -2.0% mom.
For the 12-month period, CPI slowed from 3.4% yoy to 3.3% yoy, below expectation of 3.4% yoy. CPI core decelerated from 3.6% yoy to 3.4% yoy, below expectation of 3.5% yoy. Food prices was up 2.1% yoy while energy prices rose 3.7% yoy.
UK GDP holds steady in April as services offset declines in production and construction
UK GDP showed no growth in April, aligning with market expectations. The data reveals a mixed picture, with certain sectors compensating for declines in others.
Services output grew by 0.2% mom, marking its fourth consecutive month of growth, underscoring the resilience of the services sector. Conversely, production output fell by -0.9% mom, reflecting ongoing challenges in the industrial sector. Construction output declined by -1.4% mom, continuing its downward trend for the third straight month.
Looking at the three-month period from February to April compared to the preceding three months from November to January, GDP grew by 0.7%. Within this period, services expanded by 0.9%, driven by consistent monthly gains. Production also showed a positive trend with a 0.7% increase, despite the monthly volatility. However, construction suffered a -2.2% decline, indicating sustained weakness in this sector.
Japan's CGPI rises to 2.4% yoy, highest in nine months
Japan's corporate goods price index accelerated from 1.1% yoy to 2.4% yoy in May, surpassing expectations of 2.0% yoy increase. This marks the fastest annual rise in nine months. The Yen-based import goods price index also rose 6.9% yoy , up from a 6.6% yoy gain in April, indicating that the Yen's depreciation is driving up the cost of raw material imports.
In a related development, a draft government policy blueprint released today emphasizes Japan's commitment to using "all policy tools" to sustain wage hikes. These wage increases are deemed crucial for ending deflation and achieving consistent economic growth above 1%, despite the country's rapidly shrinking population.
China's CPI stagnates in May, PPI remains in negative territory
China's CPI rose 0.3% yoy in May, unchanged from the previous month's reading and falling short of the expected 0.4% yoy increase. Food prices declined by -2.0% yoy, while non-food prices saw a modest increase of 0.8% yoy. Prices of consumer goods remained flat, and service prices rose by 0.8% yoy .
On a monthly basis, CPI edged down by -0.1% mom, missing the expectation of no change. Food prices were stable, but non-food prices fell by -0.2% mom, consumer goods prices decreased by -0.1% mom, and service prices also fell by 0.1% mom.
PPI dropped by -1.4% yoy, an improvement from the previous month's -2.5% yoy decline and better than the expected -1.8% yoy fall. Despite this improvement, PPI has been negative for the 20th consecutive month, indicating ongoing deflationary pressures in the industrial sector.
GBP/USD Mid-Day Outlook
Daily Pivots: (S1) 1.2713; (P) 1.2732; (R1) 1.2759; More...
GBP/USD's strong rally and firm break of 1.2816 support confirms resumption of rise from 1.2298. Intraday bias is back on the upside for 1.2892 resistance. Decisive break there will strengthen the case that correction from 1.3141 has completed, and bring further rally to retest this high. On the downside, break of 1.2687 support is needed to indicate short term topping. Otherwise, outlook will stay bullish in case of retreat.
In the bigger picture, price actions from 1.3141 medium term top are seen as a corrective pattern. Fall from 1.2892 is seen as the third leg which might have completed already. Break of 1.2892 resistance will argue that larger up trend from 1.0351(2022 low) is ready to resume through 1.3141. Meanwhile, break of 1.2445 support will extend the corrective pattern with another decline instead.
Economic Indicators Update
| GMT | Ccy | Events | Actual | Forecast | Previous | Revised |
|---|---|---|---|---|---|---|
| 23:50 | JPY | PPI Y/Y May | 2.40% | 2.00% | 0.90% | 1.10% |
| 01:30 | CNY | CPI Y/Y May | 0.30% | 0.40% | 0.30% | |
| 01:30 | CNY | PPI Y/Y May | -1.40% | -1.80% | -2.50% | |
| 06:00 | GBP | GDP M/M Apr | 0.00% | 0.00% | 0.40% | |
| 06:00 | GBP | Industrial Production M/M Apr | -0.90% | -0.10% | 0.20% | |
| 06:00 | GBP | Industrial Production Y/Y Apr | -0.40% | 0.30% | 0.50% | |
| 06:00 | GBP | Manufacturing Production M/M Apr | -1.40% | -0.20% | 0.30% | |
| 06:00 | GBP | Manufacturing Production Y/Y Apr | 0.40% | 1.60% | 2.30% | |
| 06:00 | GBP | Goods Trade Balance (GBP) Apr | -19.6B | -14.2B | -14.0B | |
| 06:00 | EUR | Germany CPI M/M May F | 0.10% | 0.10% | 0.10% | |
| 06:00 | EUR | Germany CPI Y/Y May F | 2.40% | 2.40% | 2.40% | |
| 12:30 | USD | CPI M/M May | 0.00% | 0.20% | 0.30% | |
| 12:30 | USD | CPI Y/Y May | 3.30% | 3.40% | 3.40% | |
| 12:30 | USD | CPI Core M/M May | 0.20% | 0.30% | 0.30% | |
| 12:30 | USD | CPI Core Y/Y May | 3.40% | 3.50% | 3.60% | |
| 14:30 | USD | Crude Oil Inventories | -1.2M | 1.2M | ||
| 18:00 | USD | Fed Interest Rate Decision | 5.50% | 5.50% | ||
| 18:30 | USD | FOMC Press Conference |
US CPI at 0.0% mom, 3.3% yoy in May, below expectations
US CPI was flat at 0.0% mom in May below expectation of 0.2% mom. CPI core (all items less food and energy)rose 0.2% mom, below expectation of 0.3% mom. Food prices rose 0.1% mom, while energy prices fell -2.0% mom.
For the 12-month period, CPI slowed from 3.4% yoy to 3.3% yoy, below expectation of 3.4% yoy. CPI core decelerated from 3.6% yoy to 3.4% yoy, below expectation of 3.5% yoy. Food prices was up 2.1% yoy while energy prices rose 3.7% yoy.
Gold (XAU/USD) Vulnerable Heading Into US CPI and FOMC Releases
- Gold struggles for direction ahead of key US data releases as geopolitics take a backseat.
- People’s Bank of China (PBoC) pauses gold buying following 18-Month spree.
- Downside momentum appears to be building as buyers lack conviction.
Fundamental Overview
Gold has edged higher this week yet remains under pressure heading into the US inflation data release and the FOMC decision. The steep decline in Gold at the back end of last week has left market participants in a quandary over whether a deeper retracement back toward the $2000/oz mark may finally come to fruition.
Optimism about a further decline in gold prices comes from the belief that the US Federal Reserve will adopt a hawkish stance at today’s FOMC announcement. The CME FedWatch Tool indicates that markets see a 56.9% chance of a rate cut at the September FOMC meeting. However, November is currently the most likely month for a rate cut, with an 87.58% probability. This aligns with data from the Chicago Board of Trade (CBOT), which shows that the December 2024 fed funds futures contract predicts most traders expect 28 basis points of rate cuts by year-end.
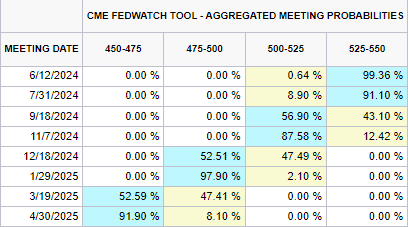
Source: CME FedWatch Tool, June 12, 2024
At the end of May, news broke that the People’s Bank of China (PBOC), which had been on a gold buying spree for the past 18 months, reported no change in its gold holdings. In its May report, the People’s Bank of China’s (PBoC) pause in gold purchases will likely encourage market participants anticipating further declines in the precious metal, even if this pause is temporary.
Geopolitical concerns which had kept Gold prices supported appear to have taken a backseat of late. News around a potential deal to end the conflict in Israel seems to have eased concerns but remains worth keeping an eye on. Any signs that a deal may fall through and a further escalation in Lebanon could increase the precious metals safe haven appeal once more and scupper hopes of further downside.
Risk Events: US Inflation and FOMC
Looking ahead to the rest of the day, US CPI data will likely stoke volatility with market consensus pointing to a 3.4% YoY print with the monthly figure expected to come in at 0.1% as opposed to the 0.3% recorded in April. A miss on the data front with a higher print than expected could push the US Dollar Index closer toward a key multi-month resistance level ahead of the FOMC decision and updated economic projections “dot plot”.
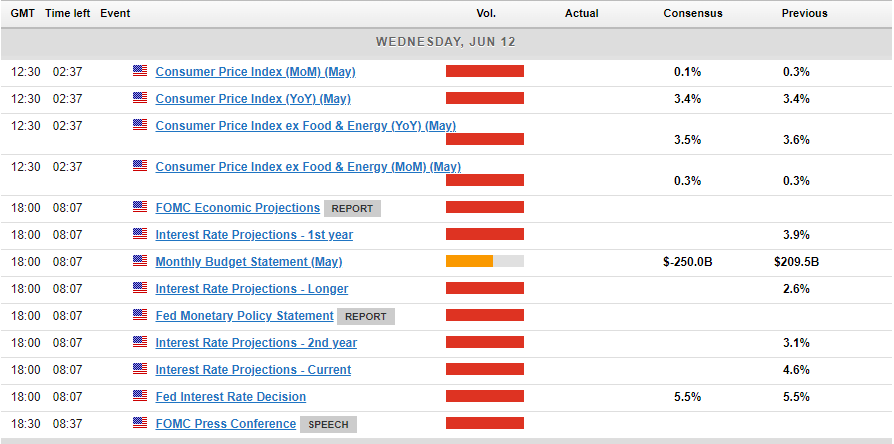
Any moves post the CPI release are likely to be short lived as market participants may be wary of committing to a direction ahead of the FOMC decision and economic projections.
Technical Outlook
Looking at Gold from a technical perspective, downside pressure remains in play. The week has started well enough but the failure of the precious metal to push back above the key resistance level around 2319-2320 handle is cause for concern. It is no doubt a reflection of the mood of market participants who are looking to the Federal Reserve to provide some clarity on the monetary path moving forward.
As you can see on the chart below, the precious metal has been printing higher highs and higher lows since bottoming out around 2287 on Friday last week. The weekly candle closed below the 2300 level for the first time since breaking above at the beginning of April.
Immediate resistance rests at 2319-2320 with a break higher bringing the 100 and 200-day MAs into focus which could halt any attempted move higher. The MAs rest just shy of the psychological 2350 handle and may be seen as a key area of confluence for market participants eyeing further potential upside. A break beyond the MAs will bring focus to the most recent highs (June 7) around the 2377 handle.
Gold (XAU/USD) Four-Hour Chart – June 12, 2024
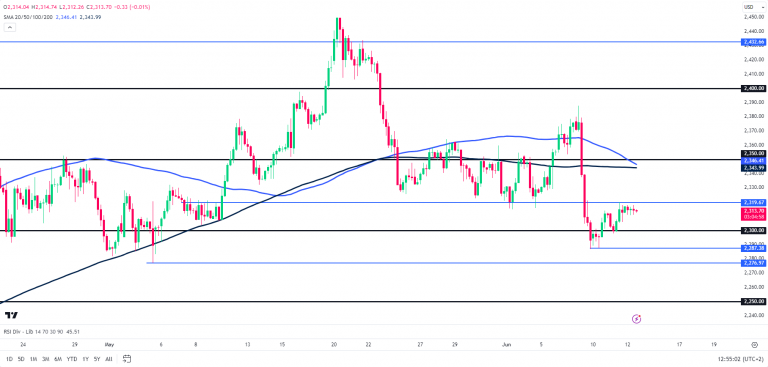
Source: TradingView.Com (click to enlarge chart)
Immediate support rests at 2287 (Fridays lows) with a break lower opening up a retest of support around the 2270 handle. Any further decline in the precious metal and market participants may focus on the psychological 2250 handle as the next barrier of support.
Euro Hits Monthly Low Amid Political Instability in France
The EUR/USD pair declined to 1.0740 on Wednesday, nearing the month’s low. This downward movement is primarily driven by the political instability in France following the significant developments in the European Parliament elections.
French President Emmanuel Macron has called for early legislative elections after the far-right party’s strong showing. While Macron retains the presidency and maintains control over foreign policy and defence, the election results could hinder his ability to implement new domestic policies and appoint ministers. There are growing concerns about Macron’s potential loss in the forthcoming elections, adding to worries about France’s financial stability.
The European Central Bank (ECB) met last week and decided to lower interest rates for the first time in five years. Despite this, the ECB adopted a cautious approach towards further monetary easing, contributing to the current economic outlook.
Attention is also focused on the ongoing US Federal Reserve meeting. While no changes in interest rates are expected, the market is eagerly awaiting the Fed’s latest economic assessment and guidance. If signalled, the timing of potential interest rate cuts could substantially impact market movements.
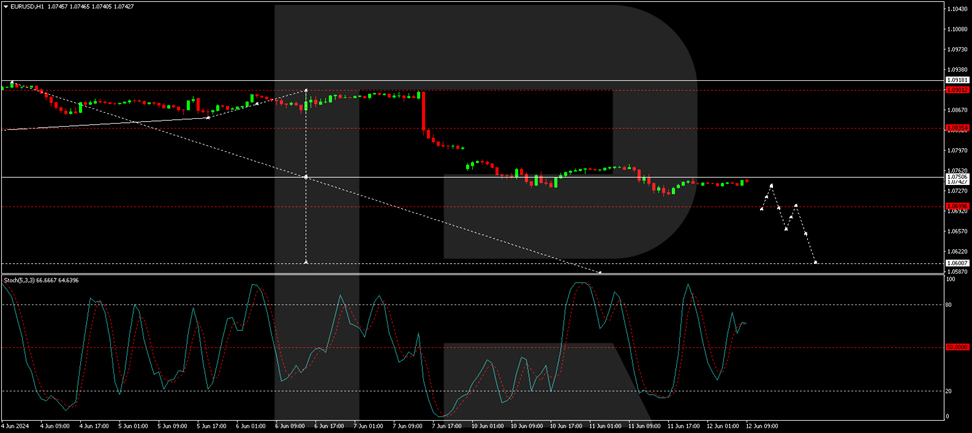
EUR/USD technical analysis
On the H4 chart, the EUR/USD is forming a consolidation range around the 1.0750 level. A potential decline to 1.0700 is considered, after which a rebound to 1.0750 may occur, a test from below. Further declines could target the 1.0660 level, possibly continuing to 1.0600. The MACD indicator supports this bearish outlook, with its signal line below zero and directed downwards.
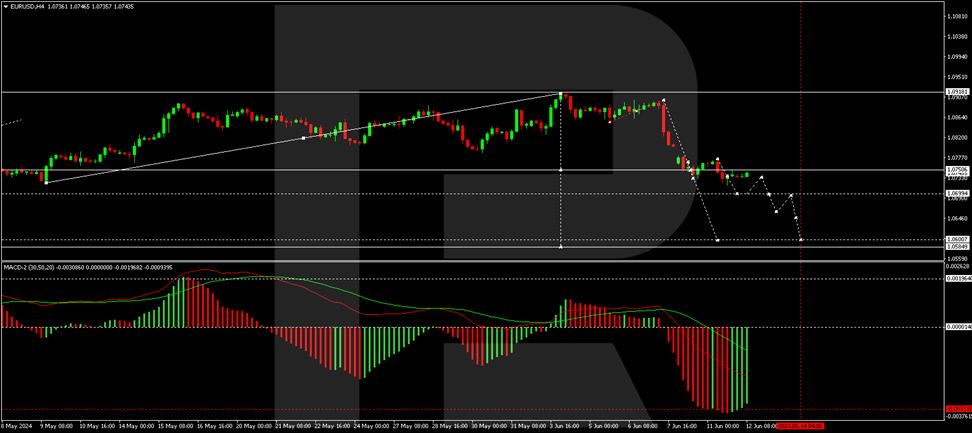
On the H1 chart, the consolidation range has expanded between 1.0773 and 1.0717. A movement towards 1.0750 is anticipated, with a forming trend continuation pattern suggesting a further drop. Exiting this range on the downside could initiate a movement towards 1.0600. The Stochastic oscillator, currently below 80, is expected to fall to 20, aligning with the potential for further declines.
Market outlook
Investors are advised to watch monetary policy developments in Europe and the US. Additionally, political events in France, which could significantly impact the EUR/USD trajectory in the near term, should be monitored closely.
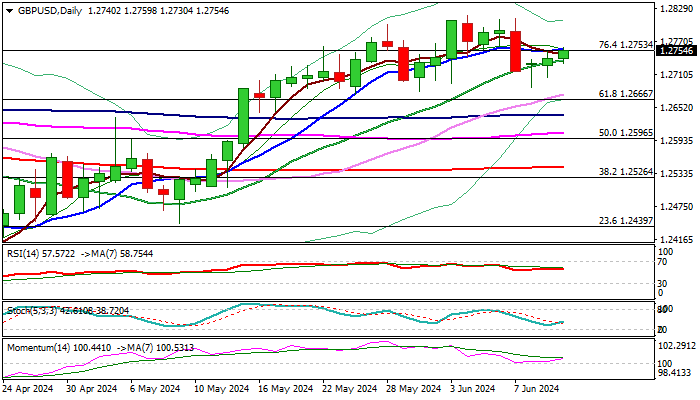
GBP/USD: Cable Remains Constructive Despite Weak UK GDP Numbers, All Eyes on US CPI/Fed
Cable ticked higher in European trading on Wednesday, showing no significant reaction on overall negative UK economic data (GDP was flat in April/construction and manufacturing output fell sharply) as traders await release of US CPI data and signals from Fed at the end of two day policy meeting.
US inflation is expected to ease while the central bank is widely expected to keep the policy unchanged again, with focus on Fed’s projections, which would provide fresh signals about the timing and pace of rate cuts.
Traders also focus on BoE’s next week policy meeting, with the central bank likely to keep interest rate unchanged for the seventh consecutive time.
Improving daily studies (rising momentum/Ma’s mainly in bullish configuration) underpin near-term action, with long shadows on last two daily candles, pointing to strong bids.
However, sustained break above 1.2753 pivot (Fibo 76.4% of 1.2893/1.2299 / 10DMA) is needed to confirm signal.
Bullish near term bias expected as long as the price stays above rising 20DMA (1.2736), while return below1.2680 higher base will be bearish.
Res: 1.2768; 1.2786; 1.2803; 1.2817.
Sup: 1.2736; 1.2680; 1.2666; 1.2638.