Sample Category Title
Fantastic, Then
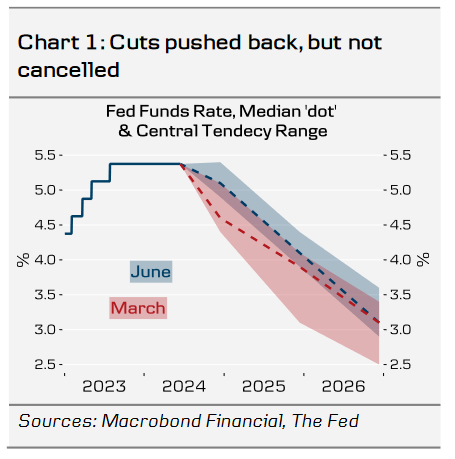
The Federal Reserve’s (Fed) dot plot plotted one rate cut for 2024, down from three in March and the Fed revised its inflation forecasts higher. But the Fed’s announcement didn’t get more hawkish than this because the distribution of the dots was much narrower than in March; 7 members plotted a one-cut preference while 8 members favoured two cuts, and 4 suggested that the Fed should not cut rates this year but hey… As a result, the distribution of the dots between those who voted for one and two rate cuts was more dovish than I expected. Plus, the dots also suggested 4 rate cuts in 2025 instead of 3, so one rate cut just jumped over to the next calendar year. And finally, we heard the Fed tweak its communication slightly: they no longer think that there is a ‘lack’ of progress in inflation toward the 2% goal but a ‘modest further progress’ instead. And that’s a big deal for the doves obviously because a progress is a progress even if it’s small. And the cherry on top, the CPI update that came in a few hours before the policy announcement was softer-than-expected. Both headline and core CPI printed a weaker-than-expected figure in May on both monthly and yearly basis, and core inflation even cooled to the slowest pace in more than 3 years. Fantastic.
The US 2-year yield tipped a toe below 4.70% but has rebounded above 4.75% this morning, the 10-year yield hit 4.25% before rebounding, the S&P500 and Nasdaq took advantage of the dovish vibes to extend gains toward a fresh record. Even the Stoxx 600 could cheer up a little. If inflation data shows further ‘modest’ progress, there is no reason we see the equity rally abate this summer.
In the FX, the US dollar index took a sharp dive below the 50-DMA yesterday on the back of a softer-than-expected CPI report and a sufficiently dovish Fed statement. The EURUSD rebounded past its 50, 100 and 200-DMA, traded as high as 1.0850 before easing to 1.08 – this is where the pair consolidates this morning. I maintain a neutral outlook as a further USD weakness should be countered by sustained downside pressure on the euro due to the chaotic political scene in France. Investors are most likely recovering from the kneejerk shock, the French 10-year yield eased yesterday on Macron’s announcement that he won’t quit his presidential seat even if he loses majority at the upcoming legislative elections. The latest polls suggests that Le Pen could win 31% of the first round votes while Macron is seen securing only 18%. But some think that the chaos that Mr Ciotto caused among Republicans could help consolidate power around a more balanced group than Le Pen’s National Rally, and Macron could offer that balanced harbour. In all cases, whatever it is, the outlook for the EURUSD remains neutral to slightly positive. The political shenanigans are still a short-term downside risk for the single currency but a sustainably softer US dollar should help the euro hold ground against the greenback.
Across the channel, Cable is preparing to test the March peak despite election jitters as a likely Labour victory in the UK is unusually seen as being a positive outcome for both sterling and the British assets. Here in Switzerland, a further dollar weakness could prevent the franc from extending losses – which wouldn’t be a bad news per se for the Swiss National Bank’s (SNB) fight against inflation that also picked up a certain momentum in the past few readings. On the flip side of the globe, the USDJPY barely reacts to the Fed decision and to the dollar’s broad-based weakness, as the Bank of Japan (BoJ) is not expected to throw fireworks at its scheduled meeting tomorrow, and finally in Australia, the Aussie-dollar gained the right to remain in the bullish trend, after having successfully held ground above a major 38.2% retracement on April to May rebound. The pair could extend gains to 68 cents.
In the energy space, US crude made an attempt on the $79pb level yesterday, fueled by dovish Fed expectations and the reflation flows, but the latest EIA data showed an unexpected 3.7-mio barrel build in the US inventories last week and the IEA said yesterday that global oil market faces a ‘major’ surplus this decade due to the shift away from fossil fuels. They predict that oil demand will level off around 105.6 mio barrels per day and that there will be around 8 mio barrel gap with the supply: the supply being higher than the demand by end of the decade. But the end of the decade is still a ways off, and the current reflation trade could help oil bulls make an educated attempt at the $80 per barrel resistance.
US CPI Lower Than Expected, While FOMC Signals Only One Rate Cut in 2024
In focus today
Today Norges Bank (NB) will publish the regional survey for Q2, where we expect that the respondents (corporates) will be somewhat more optimistic than in February. The aggregated production index for both the current (Q2) and the next quarter (Q3) will probably end up in the range of 0.2-0.3%, which will be somewhat higher than NB assumed in the PPR in March (0.0 % in Q2).
In Sweden, we get Prospera's big quarterly Q2 survey which includes not only inflation but also wage expectations, not least among social partners. However, all price/inflation expectations are more or less aligned around 2% at all horizons so it is unlikely to show any surprises.
In the US, May PPI is due for release today. In the evening, Fed's Williams moderates a discussion at the Economic Club of New York, potentially sharing some fresh views after the Fed's rate decision yesterday.
In Japan, the policy board convenes in the Bank of Japan (BoJ) today and wraps up the meeting with a policy decision early Friday. We expect no rate change, but we do expect the BoJ to signal tapering of its bond purchases. BoJ has kept the bond purchase pace unchanged at about JPY6 trillion a month after ending negative rates and yield curve control in March. It is a natural next step to cut purchases and Governor Ueda has also communicated that this is a priority. We think the BoJ will move slowly ahead, and thus getting started now with small steps seems like a good way forward.
Economic and market news
What happened yesterday
In the US, consumer prices rose 3.3% y/y in May (Cons: 3.4%; Prior: 3.4%) and were unchanged in the seasonally adjusted monthly measure of the same. Likewise, core CPI came in lower than expected as well at 0.2%|3.4% m/m|y/y (Cons: 0.3%|3.5%; Prior: 0.3%|3.6%). This was a positive surprise for the Fed in its battle against inflation, since the 0.2% m/m core inflation print rhymes with Fed's 2% target. However, the print follows 4 months straight with higher price pressures, so there is still some way to go before we expect the Fed to be confident enough about inflation to start cutting rates. 10y US treasuries dropped around 15bp in the hours after the print. EUR/USD increased initially from 1.076 to around 1.083.
The Fed maintained its monetary policy unchanged as widely anticipated, keeping the interval for the Fed funds rate at 5.25-5.50%. The most important news is the change in the dots, which signalled delayed cuts, with median pencilling in only 1 reduction for 2024 (prev. 3) but 4 for both 2025 and 2026 (prev. 3), so 25 bp higher end of 2025 but unchanged end of 2026. 2024 core PCE forecast was adjusted to 2.8% (prev. 2.6%) while other forecasts were largely unchanged. UST yields retracted part of the earlier CPI-driven decline and USD regained strength. We make no changes to our Fed call and still expect two 25bp rate cuts this year (starting September) followed by four more in 2025.
In Europe, the EU BEV car tariffs on Chinese brands will be increased from 10% to around 20% depending on the brand. The weight of new cars in euro area HICP is 3.2%, but we do not expect this to affect inflation significantly - and thereby ECB policy rates. The Chinese government urged the EU to reconsider the tariffs on Chinese electric vehicles overnight. We see it as most likely that China will not escalate this to a trade war. China is already pressured on the trade front with the US, so they need a tolerable relationship with the EU.
ECB Vice President De Guindos spoke about monetary policy, where he stated that the ECB should move very slowly when reducing interest rates due to continued high uncertainty about the inflation outlook. De Guindos stated that he was very certain that inflation will eventually fall to 2%. However, the next few months will likely be bumpy while service inflation remains a cause for caution, he added. We still expect the next rate cut to come at the final meeting of 2024 in December.
In France, president Macron said that he would not resign if his party suffered a poor result in the upcoming snap election in June.
In the UK, GDP was unchanged in April compared to March as expected, sending the economy back in low growth territory after a strong first three months in 2024. Financial markets showed little reaction to the print, while markets still see it as highly unlikely that we will see a rate cut at next week's policy meeting.
Market movements
Equities: Global equities saw a significant rise yesterday, not due to robust demand data, but rather softer-than-expected CPI data from the US. While it superficially appeared as a classic risk-on day with equities rising across regions and cyclicals outperforming, value still underperformed growth by 1% as yields dropped like a stone. Hence, this shows how important inflation still is for investors and we cannot fully allow ourselves to think about a negative correlation between bonds and equities. Part of the rotation yesterday also relates to the high and still growing appetite for tech stocks, which is also evident in today's futures where tech is leading significantly. In the US yesterday, Dow fell by 0.1%, while S&P 500 rose by 0.9%, Nasdaq by 1.5%, and Russell 2000 by 1.6%. Asian markets are mostly higher this morning, with (again) a noticeable appetite for tech in South Korea and Taiwan leading the advances. European futures are lower while US futures are higher this morning.
FI: Yields rose on the back of the slightly hawkish revisions to the FOM'’s dots, though the move was not sufficient to counterbalance the strong market reaction following the soft CPI figures. The market pricing of cuts this year dropped from 50bp to 45bp in response to the statement/SEP release, and Powell managed to maintain that level throughout the press conference. 10Y UST yields are trading 8bp lower relative to yesterday morning, while the 10Y Bund yield is down 9bp. Peripherals saw big tailwinds with 10Y BTP yields declining 15bp through the day. The Bund ASW-spread widened for the third consecutive day with the level now trading slightly above 29bp.
FX: EUR/USD bounced back yesterday after US CPI inflation was lower than expected. That further spurred a rally in Scandi currencies where EUR/SEK fell briefly below 11.20. JPY also found some relief - USD/JPY dipped below 156.
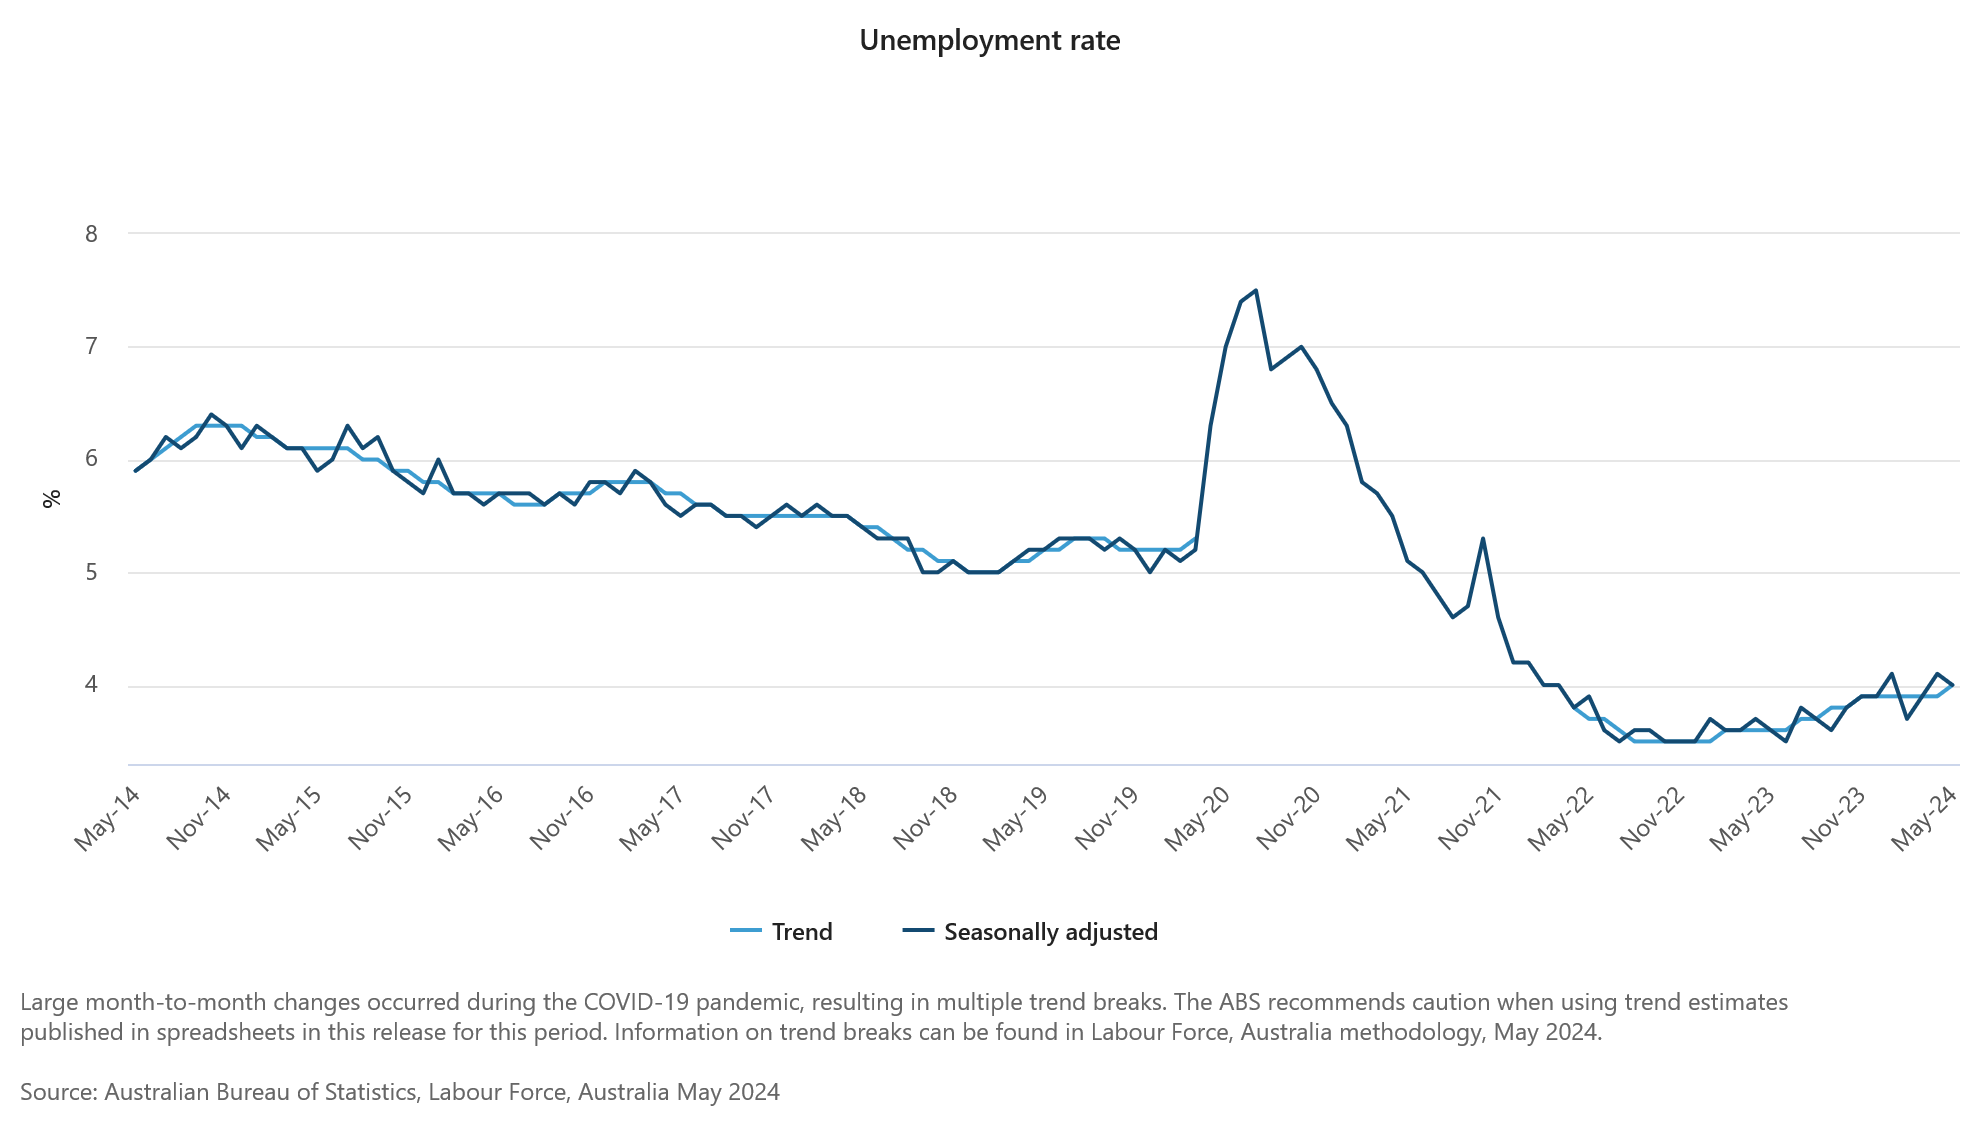
Australia’s employment rises 39.7k, labor market remains relatively tight
Australia's labor market demonstrated resilience in May, with employment increasing by 39.7k, slightly surpassing expectations of 39.0k. Full-time jobs saw a significant rise of 41.7k, while part-time jobs experienced a slight decline of -2.1k.
Unemployment rate decreased from 4.1% to 4.0%, aligning with market forecasts. Key labor metrics, such as the employment-to-population ratio and the participation rate, remained steady at 64.1% and 66.8%, respectively. However, monthly hours worked dipped by -0.5% on a month-over-month basis.
Bjorn Jarvis, ABS head of labor statistics, highlighted that the number of unemployed people, though nearing 600k, is still about 110k fewer than in March 2020, before the pandemic.
Additionally, both the employment-to-population ratio and participation rate are significantly higher than pre-pandemic levels. Jarvis pointed out that these factors, along with sustained high job vacancy levels, indicate that the labor market "remains relatively tight, though less so than in late 2022 and early 2023."
Oil Prices Recovers Sharply, Fed Holds Rates Steady
Key Highlights
- Crude oil prices started a strong recovery wave above the $75.00 resistance zone.
- There was a break above a key bearish trend line with resistance at $74.90 on the 4-hour chart.
- Bitcoin surged above $67,500 before trimming most gains.
- GBP/USD rallied to a new multi-week high and traded above 1.2800.
Crude Oil Price Technical Analysis
In the past few days, Crude oil prices saw a decent recovery wave from the $72.65 zone. The price climbed above the $73.50 and $74.50 levels to move into a positive zone.
Looking at the 4-hour chart of XTI/USD, the price even cleared the 200 simple moving average (green, 4-hour) and the 100 simple moving average (red, 4-hour). There was a break above a key bearish trend line with resistance at $74.90.
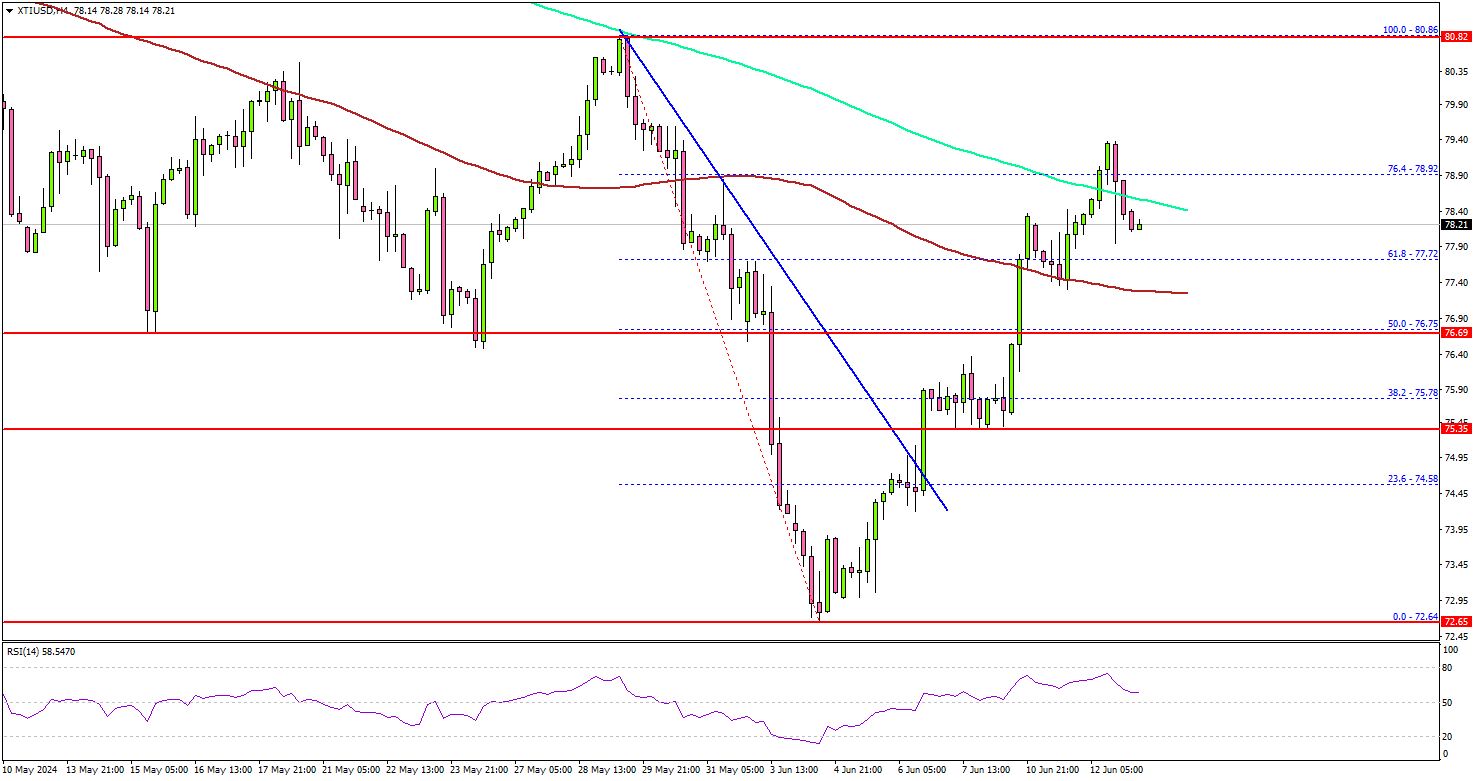
The price surpassed the 76.4% Fib retracement level of the downward move from the $80.86 swing high to the $72.64 low. On the upside, the price is facing hurdles near the $80 level.
The next major resistance is near the $80.80 zone, above which the price may perhaps accelerate higher. In the stated case, it could even visit the $82.50 resistance.
If not, the price might dip again and test the $77.80 support. The first major support on the downside is near the $76.75 level. The next major support is at $75.50 or, below which the price might test $74.20. Any more losses might send oil prices toward $72.65.
Looking at Bitcoin, there was a sharp increase after the price broke the $67,500 resistance zone, but there was no upside continuation.
Economic Releases to Watch Today
- US Initial Jobless Claims - Forecast 225K, versus 229K previous.
- US Producer Price Index for May 2024 (YoY) – Forecast +2.5%, versus +2.2% previous.
Fed’s balanced projections have something for both hawks and doves
S&P 500 and NASDAQ extended their record runs overnight, but that was mainly fueled by softer-than-expected May US CPI data. Market reaction to FOMC's rate decision was indeed subdued, reflecting the balanced nature of the new economic projections and dot plot, which offered something for both hawks and doves.
On the hawkish side, the median projection now indicates only one rate cut this year, a sharp shift from the three cuts anticipated back in March. The balance of the dot plot showed 11 members favoring one or no cuts versus 8 members advocating for two cuts, indicating a significant hurdle for those seeking more aggressive rate reductions.
Although some argue that not all FOMC members vote on policy decisions, potentially making the actual voting balance more dovish, it's clear that Fed will require further encouraging inflation data, similar to the yesterday's May CPI figures, before considering any policy easing.
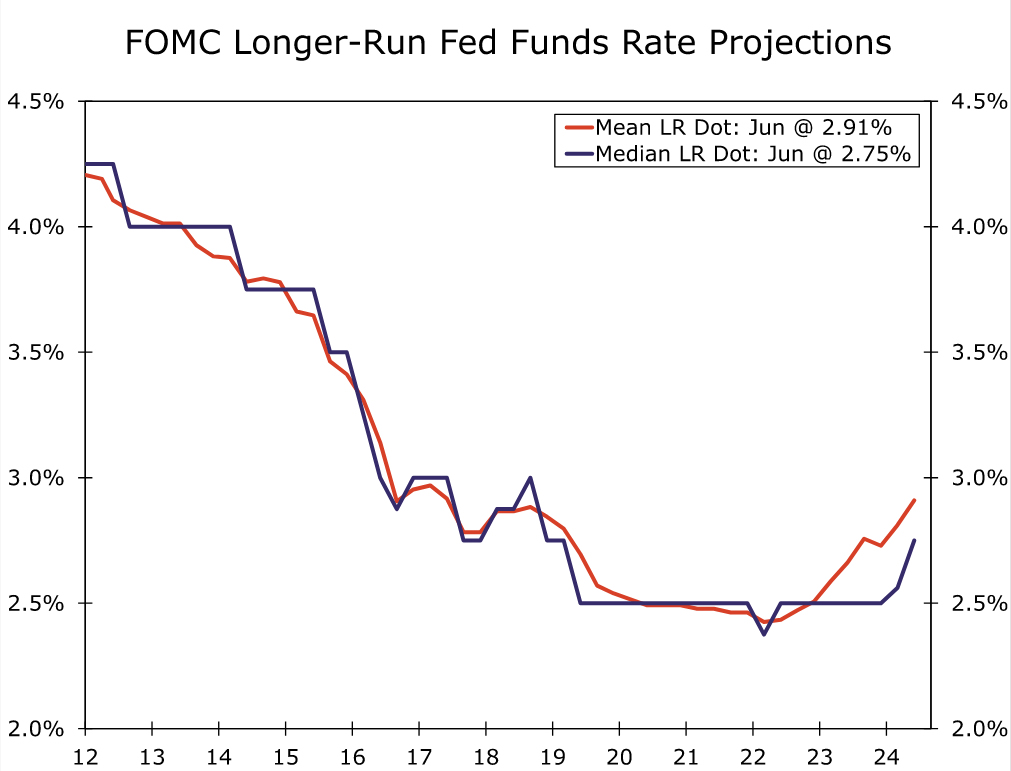
Another hawkish signal was the increase in the long-run "neutral" rate from 2.6% to 2.8%. This rate has now risen by more than a quarter of a percentage point over Fed's last two sets of projections. That suggests officials believe inflation will be more challenging to control in the future. However, Fed Chair Jerome Powell downplayed the significance of this increase, noting that it does not necessarily influence short-term rate projections.
On the dovish side, no FOMC members projected another rate hike, compared to two who had previously indicated the possibility of one more hike. This consensus suggests that all policymakers prefer to maintain the current interest rate level to combat inflation rather than tightening further, which should reassure most investors.
Going forward, Powell emphasized that Fed would make decisions based on the totality of incoming data rather than pre-determining future actions. He elaborated, "it's going to be not just the inflation readings. It's going to be the totality of the data, what's happening in the labor market, what's happening with the balance of risks, what's happening with the forecasts, what's happening with growth."
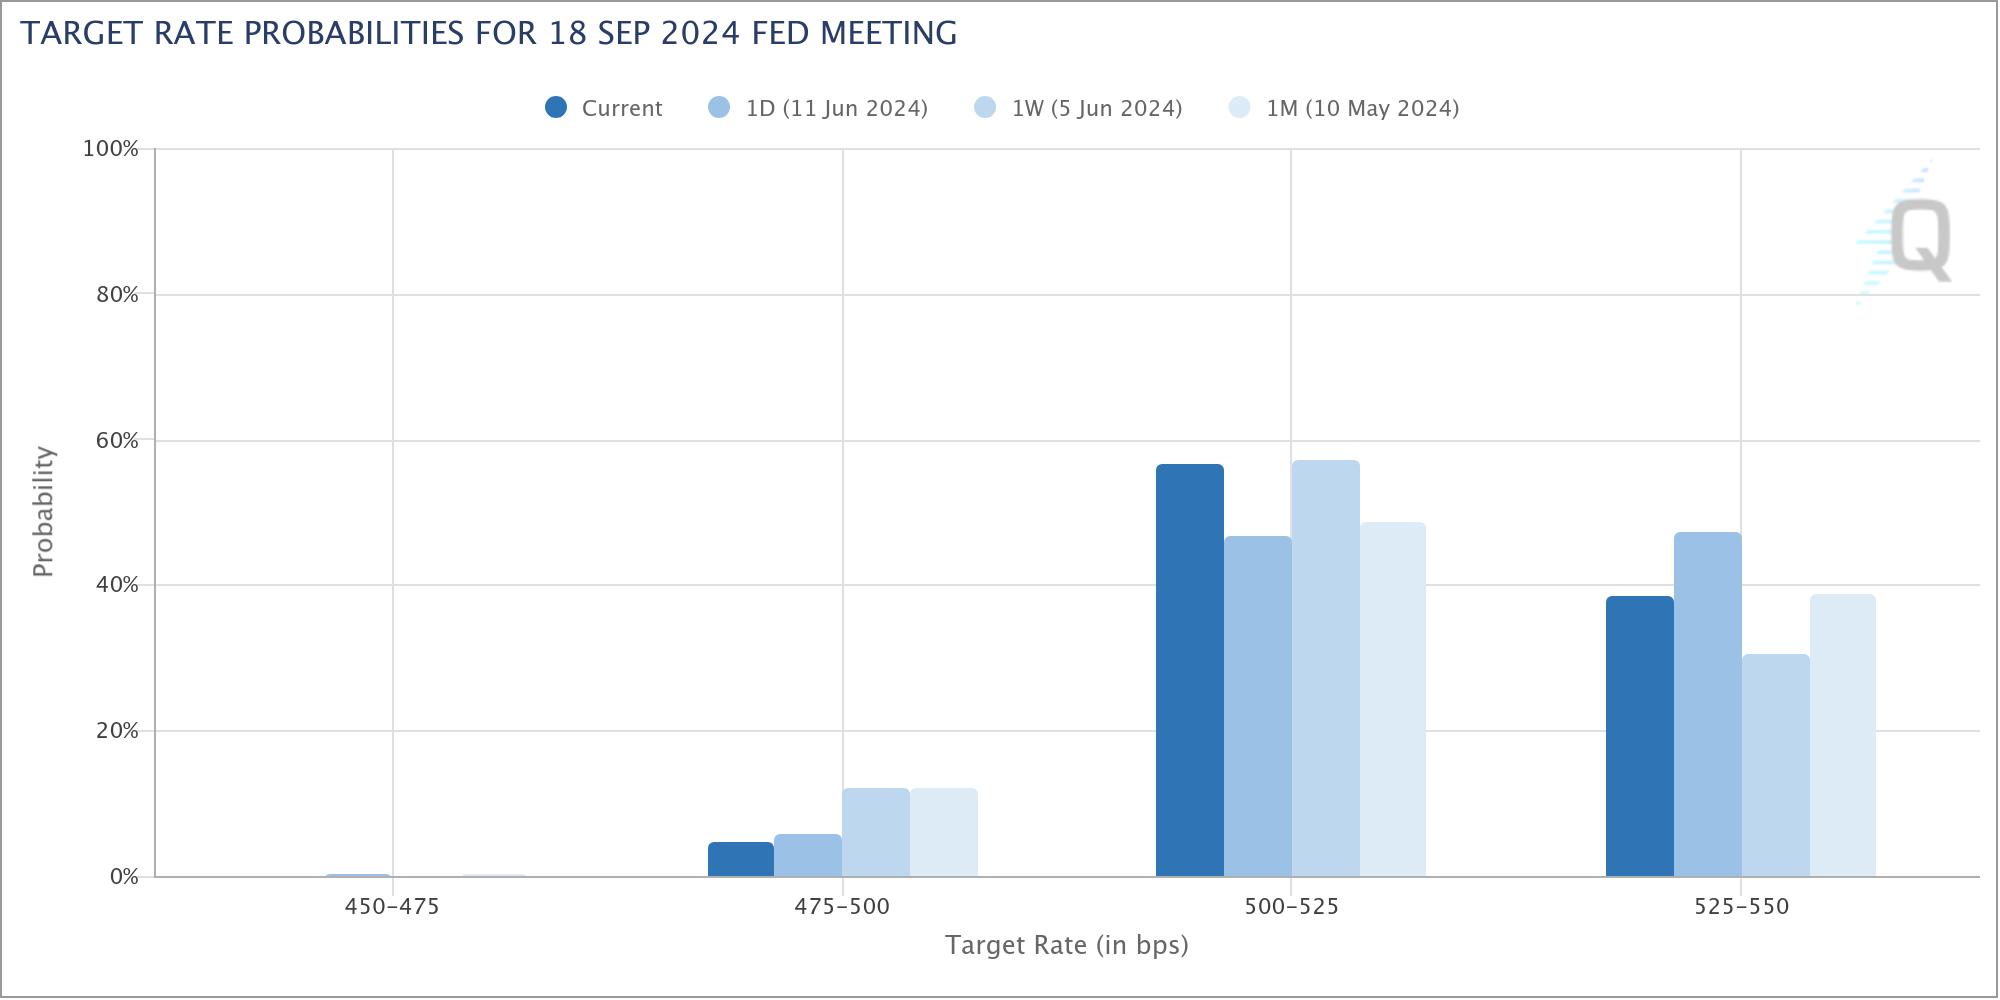
Currently, Fed funds futures indicate a 61% chance of a rate cut in September, even lower than the 69% chance a week ago before the release of strong non-farm payroll data. The odds would likely continue to fluctuate in the current range until significant progress is seen in disinflation.
Patience and Caution Paramount for the FOMC
The June Committee forecasts are based on the momentum of Q1 not Q2’s softening. Westpac continues to expect incoming data to justify two cuts in 2024, beginning in September.
The FOMC showed considerable caution regarding both inflation and economic momentum at the June meeting, referencing the strength of Q1 2024 rather than the emerging softening of Q2. March’s median view for 2024 of three cuts has been reduced to one at June. However, four cuts are now seen in 2025 to 4.125%, up from three; while the end-2026 view is unrevised at 3.125%.
Parsing the updated price forecasts, it is apparent that the near-term view for policy is predicated on no further improvement in inflation in 2024 and above-target inflation in 2025. At April, annual headline PCE inflation was 2.7%yr and core PCE inflation 2.8%yr. By December 2024, the FOMC expects those rates to be 2.6%yr and 2.8%yr; and come December 2025, both rates are still seen above target at 2.3%yr.
In the press conference, Chair Powell referenced these forecasts as “conservative” and also recognised that additional outcomes in line with the May CPI report (0.0% headline and 0.2% core readings for the month despite continued strength in the shelter component, 0.4%) would lead to a different, more benign, inflation profile. Asked in the Q&A whether the published forecasts incorporated the latest CPI print, Chair Powell noted that, when significant data is released during the meeting, participants are reminded they have the opportunity to revise their forecasts, but “most people generally don’t”. We believe it is appropriate to take from this information, and the previously telegraphed view that one data print does not make a trend, that the persistence in the inflation forecast at June is a function of 2023 and Q1 2024’s strength rather than the signal of April and May.
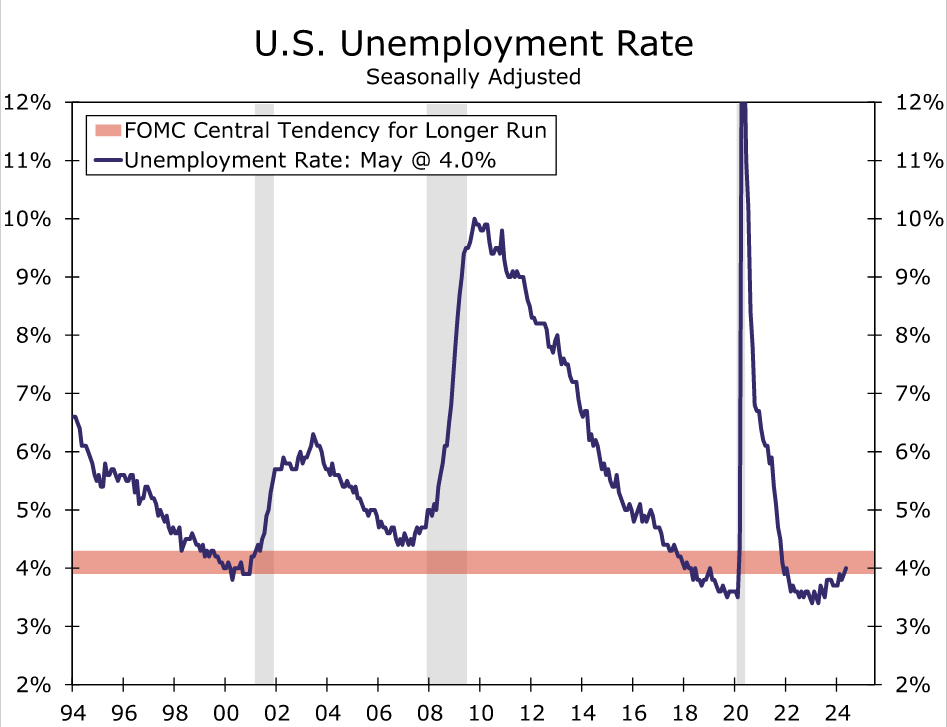
Also underpinning their policy view is enduring strength in the labour market; the unemployment rate is expected to peak at 4.2% at end-2025 from 4.0% today after which it edges down to 4.1% at end-2026 – a figure consistent with full employment based on the Committee’s 4.2% ‘longer run’ view. This assessment of the labour market is clearly based on the momentum of nonfarm payrolls, referenced in the press conference opening statement, not the stalling out of household employment survey (a 31k month-average growth pace over the past year compared to nonfarm payrolls 230k) corroborated by the ISM manufacturing and NFIB employment indexes as well as the Beige Book. FOMC members are also clearly not giving any weight to the risk of outright job declines, signalled recently by the ISM services employment index.
Given these views on the labour market, it is unsurprising that the Committee also expect GDP growth to remain above trend over the forecast horizon, at 2.1%yr in 2024 then 2.0%yr in 2025 and 2026. The ‘longer run’ view suggests FOMC members continue to see trend or potential growth at 1.8%. Robust domestic demand in Q1 2024 following a strong 2023 is the basis of this forecast; though, as for the labour market, recent months have pointed to a further slowing in activity growth.
Westpac also expects a robust outlook for the US economy in 2024 and beyond. However, we place greater weight on the emerging downside risks for activity and the labour market. Our baseline GDP forecast is for annual growth to slow to trend by end-2024 and modestly below in 2025, leading to an unemployment rate of 4.5% come mid-2025 – still a very healthy labour market versus history, but one with a degree of slack. We are also mindful that the household savings rate is low versus history and consumers are very cautious on the outlook, particularly for their family finances. As a result, we assess a greater degree of fragility in household demand than was the case in 2023 or 2022 and is evident in the FOMC’s current forecasts.
So, while the Committee now only sees one cut in 2024, we expect the data to justify two, with the first most likely in September. Like the FOMC, we then see four cuts through 2025. While the median expectation for 2024 has come down, it is important to recognise that the majority of the Committee are fairly evenly split on one versus two cuts in 2024, with eight favouring two and seven one – the remaining four are currently for no change. The range of views amongst Committee members for 2025 is broad, further highlighting the data dependent policy approach of the FOMC.
Where we see greater upside risk for inflation and policy is in 2026 and beyond. In 2026, we expect only two further cuts against the FOMC’s unrevised median expectation of four. Consequently, our low point for the fed funds rate for the coming cutting cycle is 3.375% compared to the FOMC’s 3.1%. Beyond the forecast horizon, we also believe inflation uncertainty will likely require the fed funds rate to remain above 3.0% compared to the FOMC’s longer run 2.8% estimate, previously 2.6%.
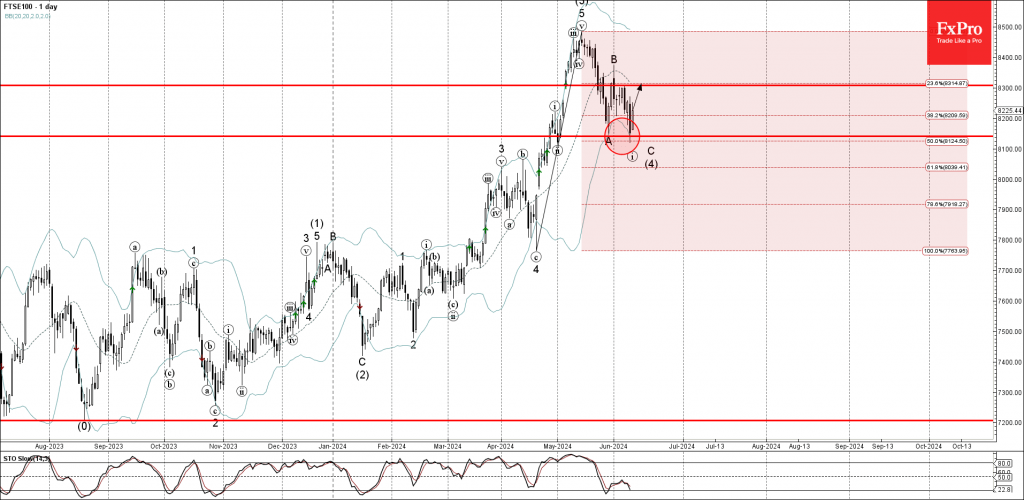
FTSE 100 Index Wave Analysis
- FTSE 100 Index reversed from support level 8140.00
- Likely to rise to resistance 8300.00
FTSE 100 Index recently reversed up from the pivotal support level 8140.00 (which also stopped the previous correction A at the end of May).
The support level 8140.00 was further strengthened by the lower daily Bollinger Band and by the 50% Fibonacci correction of the upward impulse from April.
Given the clear daily uptrend, FTSE 100 Index be expected to rise further to the next resistance 8300.00, which has been reversing the index from May.
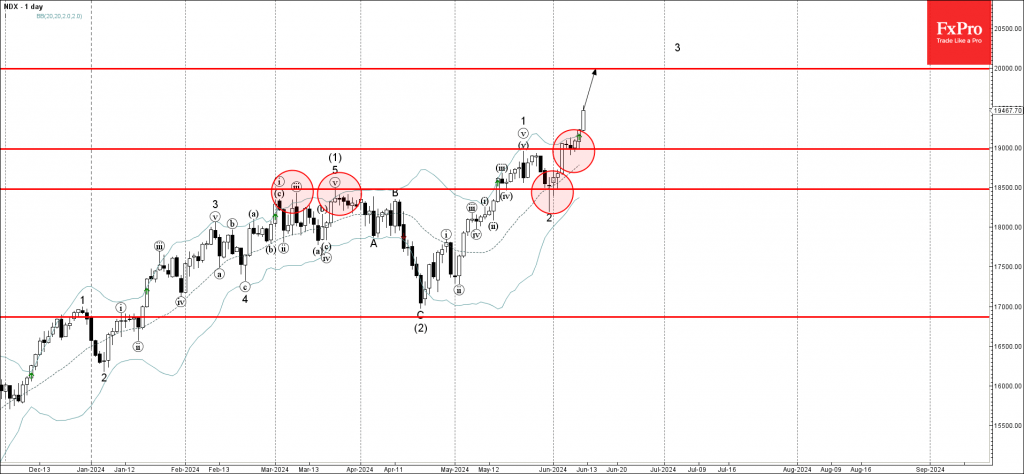
NASDAQ 100 Wave Analysis
- NASDAQ 100 reversed from support level 19000.000
- Likely to rise to resistance 20000.00
NASDAQ 100 Index recently reversed up from the support level 19000.000 (former resistance from the middle of May, acting as the support after it was broken previously).
The upward reversal from the support level 19000.000 continues the active short-term impulse wave 3 of the higher order impulse wave (3) from April.
Given the clear daily uptrend, NASDAQ 100 Index be expected to rise further to the next round resistance 20000.00, target price for the completion of the active impulse wave 3.
Fed Review: We Still See Cuts Starting in September
- The Fed maintained its monetary policy unchanged as widely anticipated.
- The 'dots' signalled delayed cuts, with median pencilling in only 1 reduction for 2024 (prev. 3) but 4 for both 2025 and 2026 (prev. 3). 2024 Core PCE forecast was adjusted to 2.8% (prev. 2.6%) while other forecasts were largely unchanged.
- UST yields retracted part of the earlier CPI-driven decline and USD regained strength. We make no changes to our Fed call and still expect two 25bp rate cuts this year (starting September) followed by four more in 2025.
The FOMC's June meeting provided markets with very few new forward-looking signals. Inflation and policy rate expectations were revised modestly higher for this year, but Powell noted that the change was largely a backward-looking reaction to the 'pause in progress' seen in Q1 inflation data. CPI prints received since the May meeting have been a clear 'step to the right direction', you can read our views on today's release from Global Inflation Watch - The Fed welcomes easing supercore inflation, 12 June.
Powell mentioned that FOMC participants had a chance to revise their previously set forecasts after the CPI release but did not specify if this was widely the case (only saying that 'most policymakers [generally] don't')
The median 2024 dot shifted higher slightly more than what we had anticipated, signalling only one rate for this year. That said, the FOMC remains divided with four participants calling for no cuts, seven seeing 1 cut and eight expecting 2 cuts. Furthermore, the cuts were not removed from the forecast profile, but rather pushed back to 2025 and 2026, where the Fed now sees four cuts per year instead of three. It is worthwhile noting that the 'longer-term' dot also took another step higher (2.8%; from 2.6%). But when asked, Powell re-emphasized that the Fed still sees the current policy stance firmly restrictive.
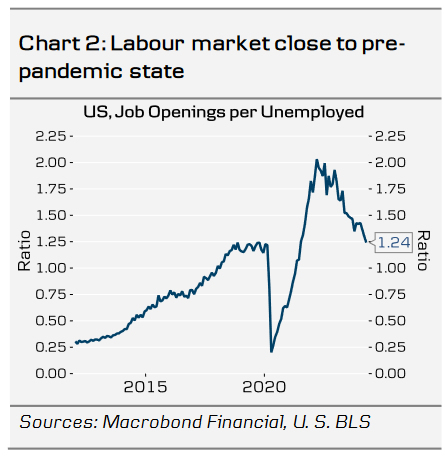
Powell noted that labour market balance has now largely returned back to pre-pandemic state, illustrated for example by the ratio of job openings to unemployment (Chart 2). He refrained from speculating about potential drivers or implications of the sharp divergence between nonfarm payrolls and household employment seen in last Friday's Jobs Report. See the macro section of this week's RtM USD, 11 June, for our take on the matter.
Overall, the Fed remains in a comfortable position with no imminent need to influence current financial conditions. As expected, Powell felt no urgency to even speculate with the timing of the first cut. The Fed is still biased towards easing and Powell underscored the need to remain conscious about downside economic risks as well.
We remain happy with our call for two 25bp rate cuts this year, followed by four more in 2025. As real interest rates are set to remain at clearly restrictive levels well towards next year, we see risks tilted towards somewhat weaker growth and higher unemployment than the Fed pencils in, although tail-risk of a deeper downturn has clearly eased. QT was not discussed today, but after the earlier announcement on slower pace starting from this month, we think that QT will complement the restrictive policy well into 2025 as well.
Markets: Lack of direction
Yields rose on the back of the slightly hawkish revisions to the SEP, though the move was not nearly sufficient to reverse the strong market reaction following the soft CPI figures out earlier today. The market pricing of cuts this year dropped from 50bp to 45bp in response to the statement/SEP release, and Powell managed to keep it there throughout the press conference. 10Y UST yields are trading about 5bp higher since the statement release.
In a similar fashion, EUR/USD edged marginally lower following the meeting, from around 1.0840 to around the 1.0800 mark. Overall, a very modest reaction, which seems fair given the lack of direction from Powell tonight. We think EUR/USD will range trade around the 1.08 level in the near term, but in the longer term, we believe the structural case for stronger US growth dynamics will take the cross lower towards 1.05/1.03 on a 6/12M horizon.
June FOMC: Sitting, Waiting, Wishing
Summary
- As expected, the Federal Open Market Committee left the federal funds rate target range unchanged at 5.25-5.50% at the conclusion of its meeting today. Yet the latest Summary of Economic Projections showed most participants continue to expect at least some reduction in the fed funds rate before the year is out.
- The median projection for the fed funds rate at year-end was raised to 5.125% from 4.625% in the March SEP, implying only one 25 bps cut before the year. However, the distribution of projections skewed toward more easing, with eight participants expecting two cuts and only four expecting rates to remain unchanged. Participants now see 100 bps of easing over 2025 compared to 75 bps in the prior SEP, which would leave the fed funds target at 4.125%.
- The delayed start to rate cuts comes as inflation has been stickier this year while economic activity remains "solid." Participants now see core PCE inflation up 2.8% on a Q4/Q4 basis compared to 2.6% in the March SEP, but GDP growth unchanged at 2.1%—above the Committee's median estimate of potential—and the unemployment rate holding at its current rate of 4.0%.
- Changes to the post-meeting statement were minimal. The Committee gave a nod to the somewhat better run of inflation data since its May 1 meeting by noting that there has been some "modest further progress" on the inflation front instead of a "lack of further progress." But, the statement reiterated that inflation remains "elevated" and the FOMC is "strongly committed" to its 2% inflation objective.
- While the May CPI report released earlier today was encouraging for the inflation outlook, the FOMC clearly needs to see more benign prints before a consensus emerges that a reduction in the fed funds rate is warranted. With few signs of that consensus emerging yet, we continue to believe that the earliest the FOMC would reduce the fed funds rate would be at its September 18 meeting, when it will have three more months of inflation and employment data in hand.
- It will be a close call between one or two 25 bps rate cuts, and the Committee seems evenly split between the two outcomes. Our base case forecast since early April has looked for a 25 bps rate cut at each of the September and December FOMC meetings. For now, our forecast remains two cuts this year and another 100 bps of easing in 2025. We will publish our standard monthly economic forecast update on Friday morning.
FOMC Still Playing the Waiting Game
As was universally expected, the Federal Open Market Committee voted unanimously to keep the target range for the fed funds rate unchanged at 5.25-5.50% at the conclusion of its meeting today. With inflation remaining elevated and economic growth still sturdy, the Committee has now held the fed funds rate steady for seven consecutive meetings. Yet an update to the Summary of Economic Projections (SEP) showed that most FOMC participants continue to expect at least some reduction in the fed funds target before the year is out.
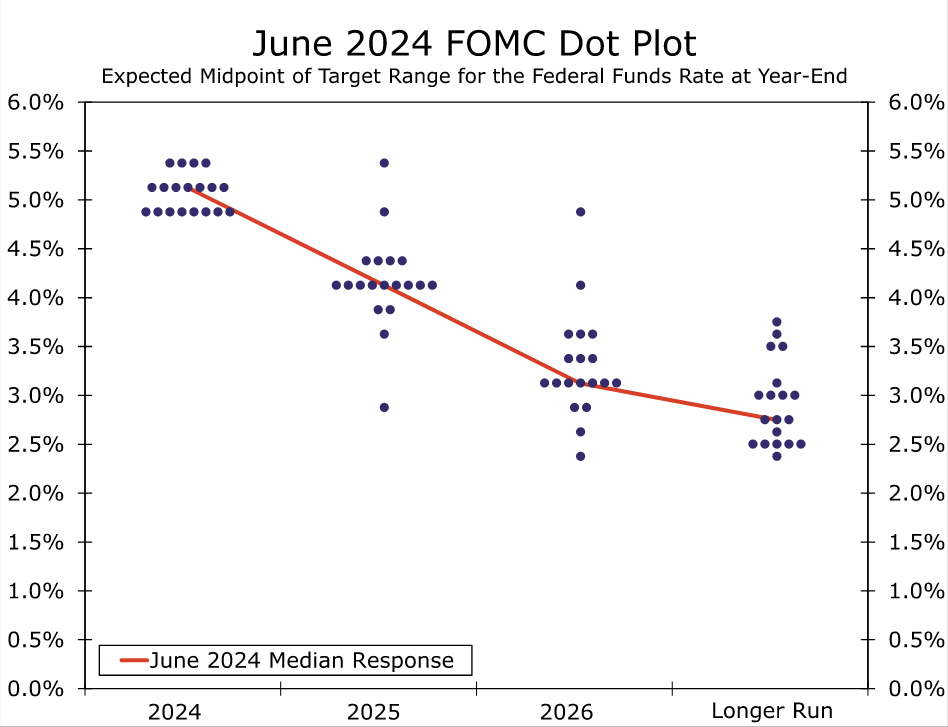
The median Committee participant penciled in one 25 bps rate cut by year-end, down from 75 bps projected in the March SEP. The distribution of the 2024 dots had a clear downward bias. Eight participants anticipated 50 bps of easing by year-end, while just four participants expected the fed funds rate to be unchanged through the end of this year (Figure 1). No participants projected the fed funds rate would rise later this year. Looking to 2025, the median dot is 4.125%, which if realized would be 100 bps of easing in addition to the 25 bps expected this year. The median longer-run dot continued to tick higher, climbing to 2.75%, the highest reading since March 2019 (Figure 2).
Elsewhere, there were few notable changes in the SEP. The median projections for real GDP growth were completely unchanged, while the median projections for the unemployment rate ticked higher by a tenth in 2025 and 2026 in what was likely a nod to the gradual upward trend in the unemployment rate (Figure 3). Headline and core PCE inflation projections were higher by two tenths in 2024 and one tenth in 2025, in line with our expectations headed into the meeting. Participants had the opportunity to adjust their projections in light of this morning's CPI report, although they did not have to make changes, and some may have elected not to given that the May data for the PCE deflator remain uncertain. Powell shared in the press conference that "most" officials do not update SEP submissions on days like this.
Back in December, the median Committee member was expecting 2.4% core PCE inflation and 75 bps of rate cuts in 2024. Today's projections look for 2.8% core PCE inflation this year and just 25 bps of cuts. The downward trend in inflation remains in place, but the bumpy path and slow-going and have led the FOMC to be more patient at this stage of the cycle.
There was only one material change to the post-meeting statement. The statement now gives a nod to the somewhat improved inflation picture since the Committee's May 1 meeting. Instead of noting that there has been a "lack of further progress" toward the Committee's 2% inflation goal, the FOMC recognized "modest further progress" in lowering inflation. Other than that, the only other change in the statement was the removal of the Committee's announcement to slow the pace of quantitative tightening, a process that began on June 1.
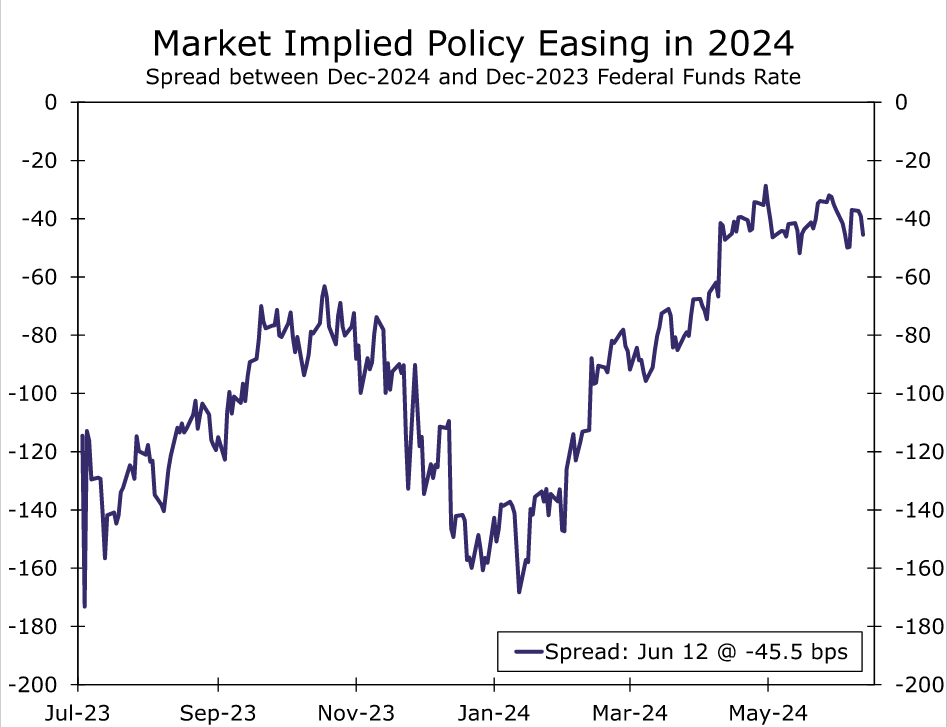
On balance, we remain confident that the FOMC will begin reducing the federal funds rate before the year is out. As we wrote in response to this morning's CPI report, we see inflation pressures continuing to subside as the year progresses. It will be a close call between one or two 25 bps rate cuts, and the Committee seems evenly split between the two outcomes. Financial market pricing also suggests a clear openness to more than one cut this year (Figure 4). Our base case forecast since early April has looked for a 25 bps rate cuts at each of the September and December FOMC meetings. For now, our forecast remains two cuts this year and another 100 bps of easing in 2025. We will publish our standard monthly economic forecast update on Friday morning.