Sample Category Title
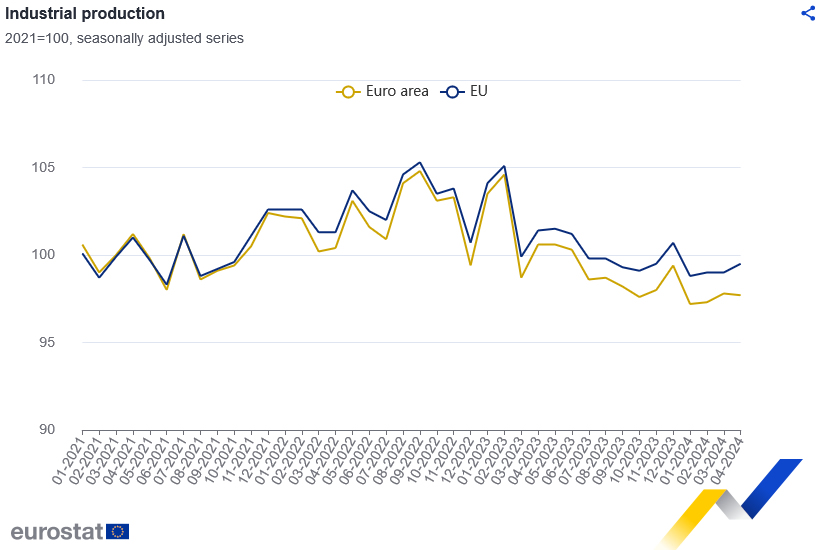
Eurozone industrial production down -0.1% mom in Apr, EU up 0.5% mom
Eurozone industrial production fell -0.1% mom in April, worse than expectation of 0.1% mom growth. Industrial production, decreased by -0.4% for intermediate goods. Production increased by by 0.4% for energy, 0.7% for capital goods, 0.3% for durable consumer goods, and 3.4% for non-durable consumer goods.
EU industrial production rose 0.5% mom. The highest monthly increases were recorded in Denmark (+10.4%), Greece (+7.0%) and Poland (+6.7%). The largest decreases were observed in Luxembourg (-6.7%), Latvia (-4.9%) and Ireland (-3.4%).
EUR/USD: Remains Constructive Despite More Hawkish Than Expected Powell
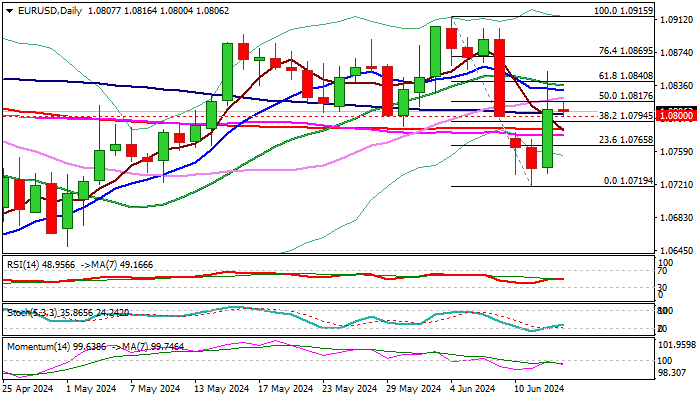
EURUSD is consolidating within a narrow range on Thursday morning, following strong rally on Wednesday (up 0.65%), but remains constructive despite Wednesday’s upside rejection and a bull-trap above converged 10/20DMA’s.
The single currency rallied on weaker than expected US May CPI numbers, though the sentiment was cooled by more hawkish than expected remarks from Fed Chair Powell.
The US policymakers were satisfied with positive signals from easing inflation and that the economy remains resilient and heading towards soft landing, however, will remain cautious about the actions on interest rates, which will continue to be data dependent.
Daily chart shows improving conditions after Wednesday’s close above the top of daily cloud generated initial bullish signal, which will look for verification on repeated close above the cloud.
On the other hand, 14-d momentum is still in the negative territory and near-term action weighed by Wednesday’s bull-trap, which is expected to impact the action as long as the price stays below 1.0835/40 zone (converged 10/20 DMA’s/Fibo 61.8% of 1.0915/1.0719), with increased downside risk expected if the price r below 1.0800/1.0785 (psychological/daily cloud top / 200DMA).
US weekly jobless claims and May Producer Price Index will be in focus today as top economic events.
Res: 1.0817; 1.0840; 1.0852; 1.0869.
Sup: 1.0800; 1.0785; 1.0765; 1.0734.
Crypto Growth Derailed
Market Picture
The cryptocurrency market failed to get on the growth rails, losing 0.7% in 24 hours to $2.44 trillion, near end-of-day levels on Wednesday. The positive effect of the soft inflation report was erased by the Fed’s comparatively tightening stance, which suppressed appetite for risk assets. This is clearly visible in the demand for cryptocurrencies despite the rally in the S&P500 and Nasdaq100 indices.
Cryptocurrency traders should prepare for the scenario: what doesn’t rise, falls. The signal for the start of an active sell-off could be the decline of BTCUSD under $65.8K, where the area of the week’s lows, the 50-day moving average, and the 76.4% Fibonacci retracement of the growth from the January lows to March peak are concentrated. The next support could be the $60K area.
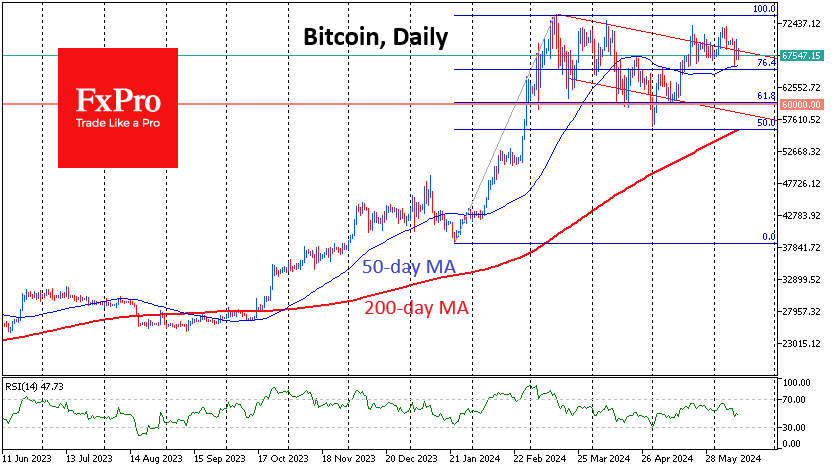
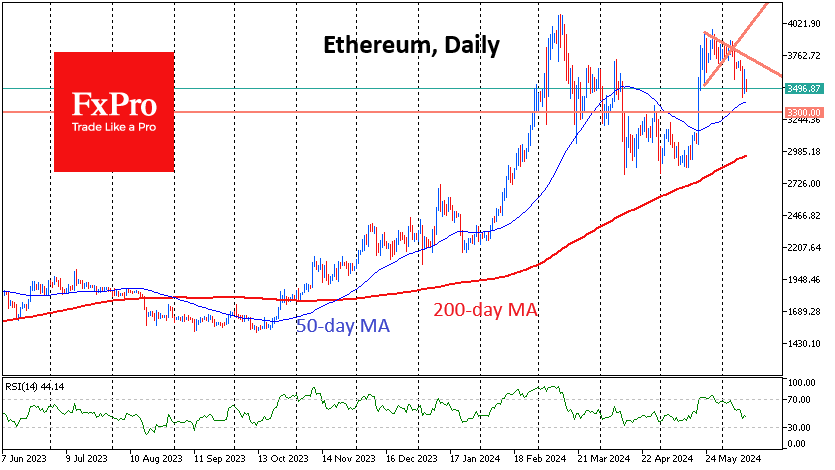
Ethereum has moved back below $3500 into the week’s lows. A failure below $3300, the pivot area from March, will confirm bearish dominance. A failure below would open a direct path to $3000.
News background
Despite impressive inflows into spot bitcoin-ETFs, arbitrage strategies between the spot and derivatives markets have kept buying pressure in check, according to Glassnode. These involve longing in the spot market and shorting in futures on the same underlying asset that is trading at a premium.
K33 Research believes the significant inflows seen in the BTC-ETF may only partly reflect arbitrage between the spot and futures markets. It’s more about demand than hedging.
CryptoQuant notes that transaction speeds on the Bitcoin network have fallen to levels of 13 years ago. BTC has failed to become the everyday payment asset its creator, Satoshi Nakamoto, dreamed of.
Ex-CEO of BitMEX Arthur Hayes and Real Vision CEO Raul Pal discussed promising altcoins, emphasising the potential of Solana (SOL) and Aptos (APT). Hayes is optimistic about Ethena (ENA), given the potential for the USDe stablecoin to “displace” USDT and USDC.
MN Trading founder Michael van de Poppe said that now is a good time for risk assets and urged buying altcoins.
AUDUSD: Buying The Dips at the Blue Box Area
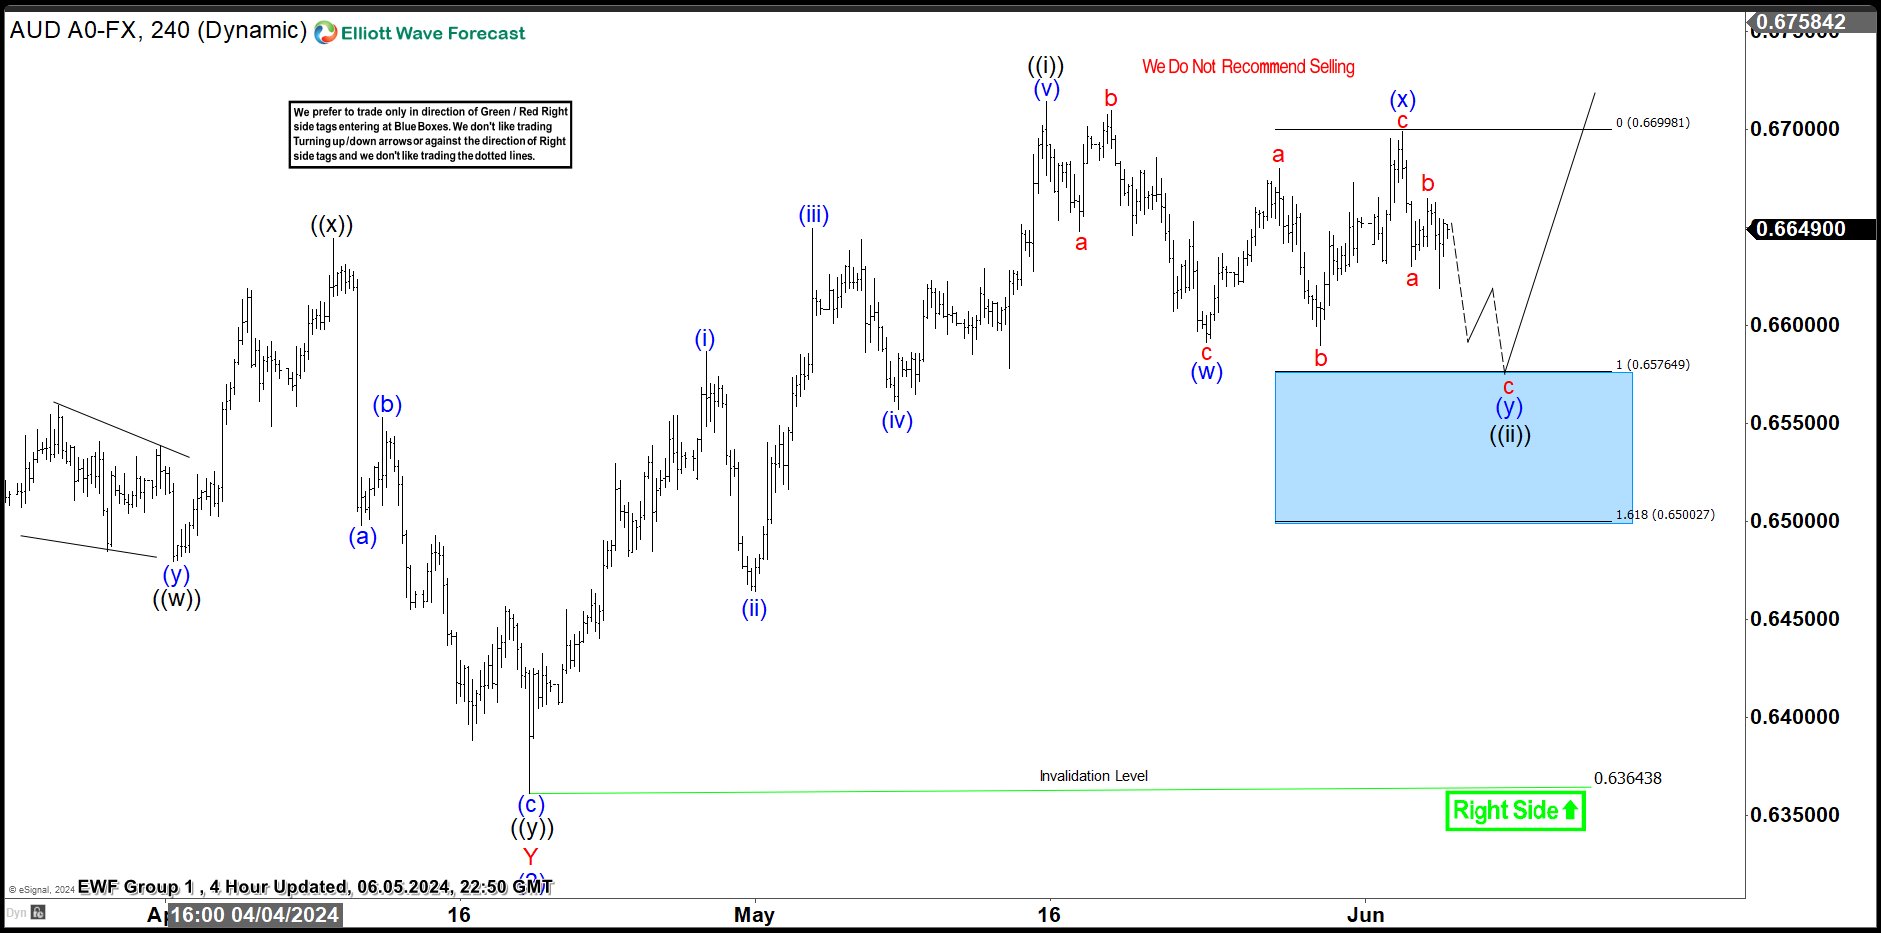
In this technical article we’re going to take a quick look at the Elliott Wave charts of AUDUSD Forex pair , published in members area of the website. As our members know, AUDUSD has recently given us correction against the 0.63618 low. The pair reached our target zone and completed correction right at the Equal Legs zone ( Blue Box Area) . In further text we’re going to explain the Elliott Wave pattern and trading setup.
AUDUSD H4 London Update 06.05.2024
The pair is correcting cycle from the 0.63618 low low. The pull back looks incomplete at the moment. As far as the price stays below (x) blue peak: 0.6699, our analysis forecasts further downside in AUDUSD toward the 0.6576-0.65002 area ( blue box).
Despite the expected extension lower, we advise against selling AUDUSD. Once the pair reaches this blue box area, we expect it to attract buyers. We can see either rally towards new highs or a corrective bounce in three waves at least. Once the bounce reaches the 50% Fibonacci retracement level against the connector high -(X) blue, we’ll secure our position by moving the stop-loss to breakeven. To safeguard our trade, we’ll closely monitor for any break below the marked invalidation level :0.65002 .
A quick reminder:
Our charts are designed for simplicity and ease of trading:
Red bearish stamp + blue box = Selling Setup
Green bullish stamp + blue box = Buying Setup
Charts with Black stamps are deemed non-tradable. 🚫
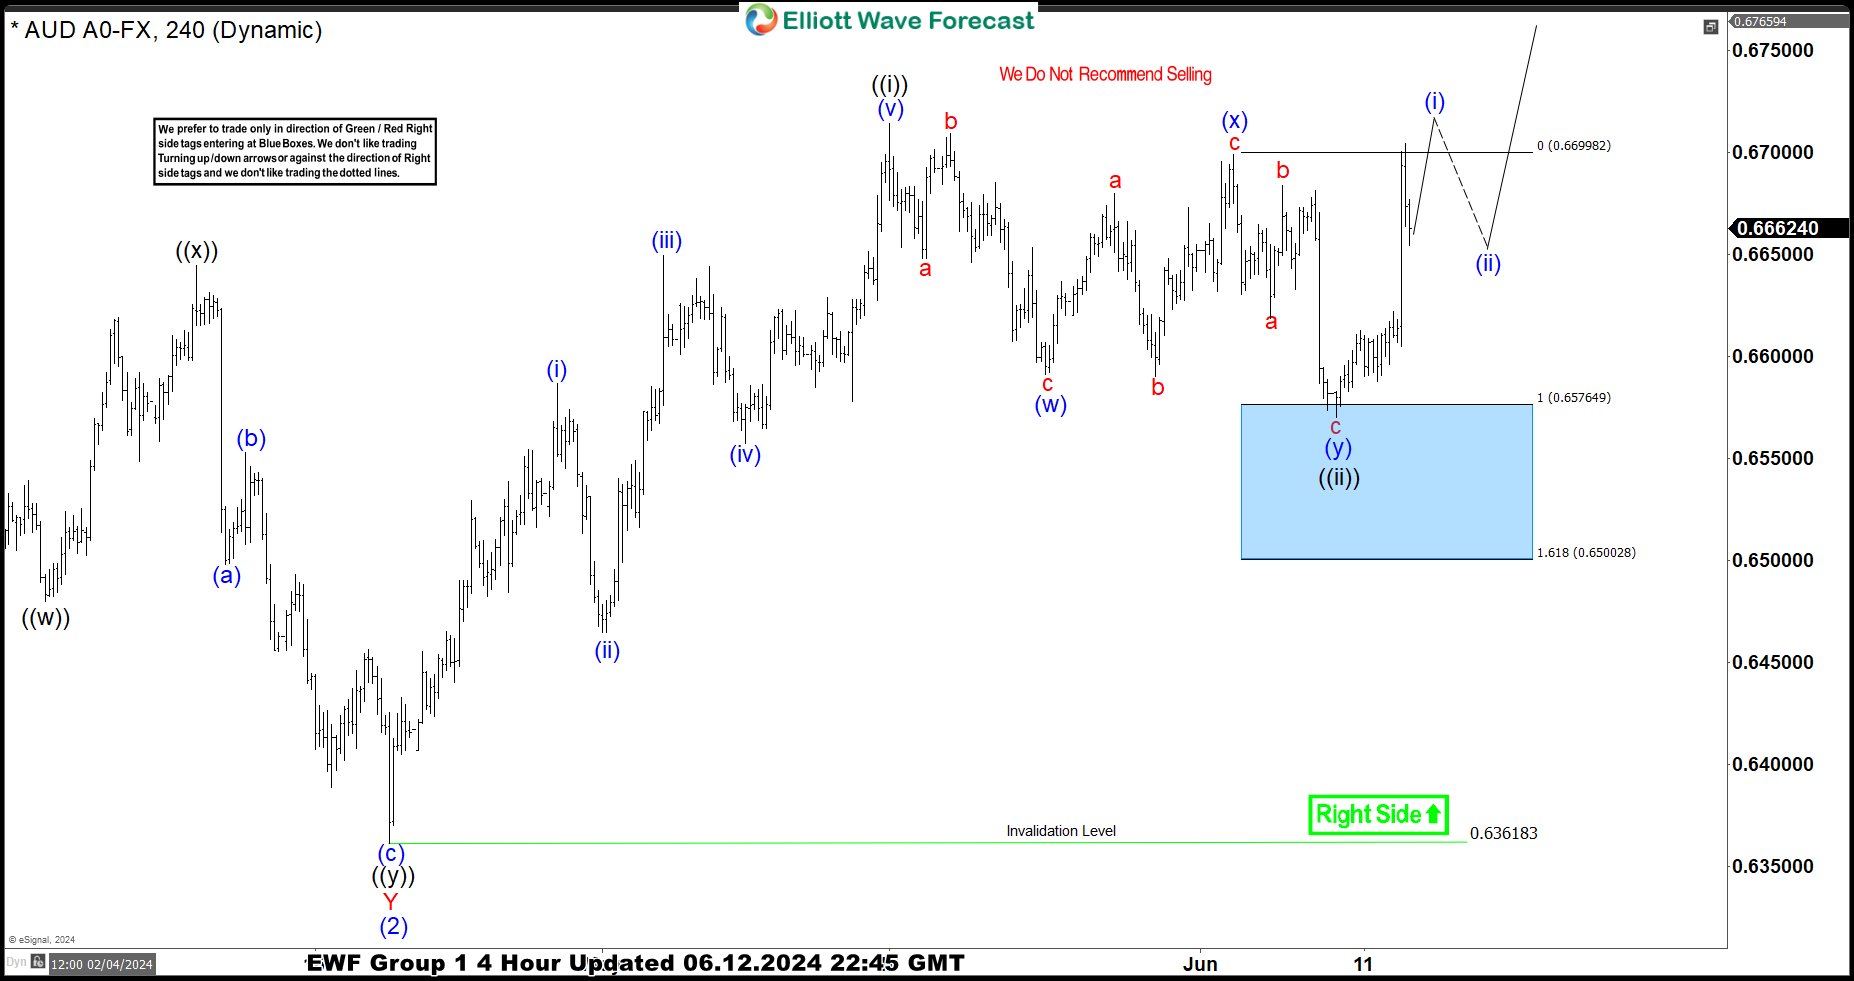
 AUDUSD H4 London Update 06.13.2024
The pair found buyers within the Blue Box area as expected. We got a nice rally from our buying zone, counting pull back completed at the 0.65697 low. The bounce has exceeded the 50% Fibonacci retracement level against the connector peak. As a result, traders who entered long positions are now enjoying risk-free profits. With the price holding above the 0.65697 low, we believe the next leg up can be in progress. For confirmation on the next leg up, we’re looking for a break above the May 16th peak.
ECB’s Vasle: Further rate cuts possible this year if data remains favorable
ECB Governing Council member Bostjan Vasle has hinted at the possibility of further rate cuts this year, provided the baseline scenario holds and economic data supports such a move.
Speaking to Finance newspaper, Vasle said, "If the baseline scenario is realized and the data are favorable, then we can probably expect further rate cuts already this year, and then also next year."
However, he cautioned that if the economic conditions are not as supportive, it would be prudent to "wait some more time with further steps."
Vasle also highlighted several risks that could slow down the disinflation process, pointing to "relatively strong" momentum in wages, ongoing economic growth, and geopolitical uncertainties. These factors could impact the ECB's decision-making process regarding future rate cuts.
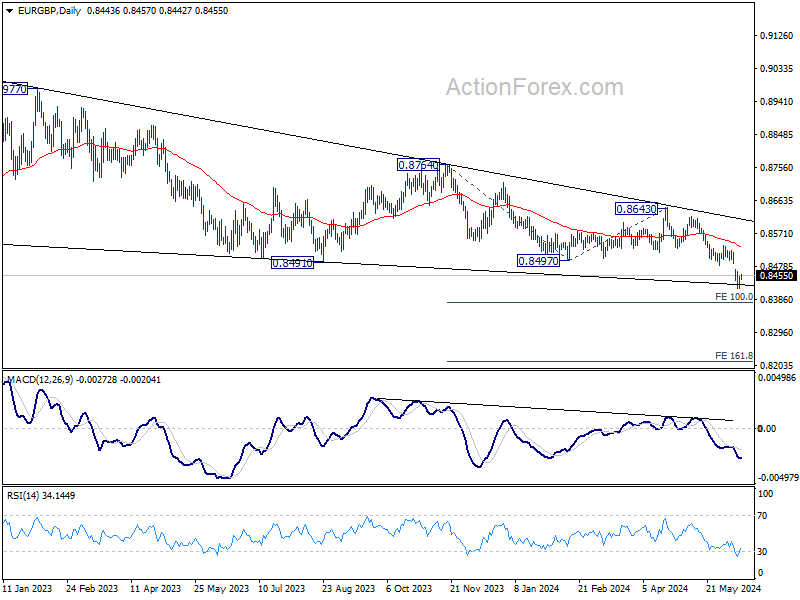
EUR/GBP Daily Outlook
Daily Pivots: (S1) 0.8425; (P) 0.8439; (R1) 0.8459; More...
Intraday bias in EUR/GBP is turned neutral with current recovery, and some consolidations would be seen first. Further decline is expected as long as 0.8482 support turned resistance holds. Below 0.8417 will resume larger down trend to 0.8376 projection level next. On the upside, firm break of 0.8482 will bring stronger rebound instead.
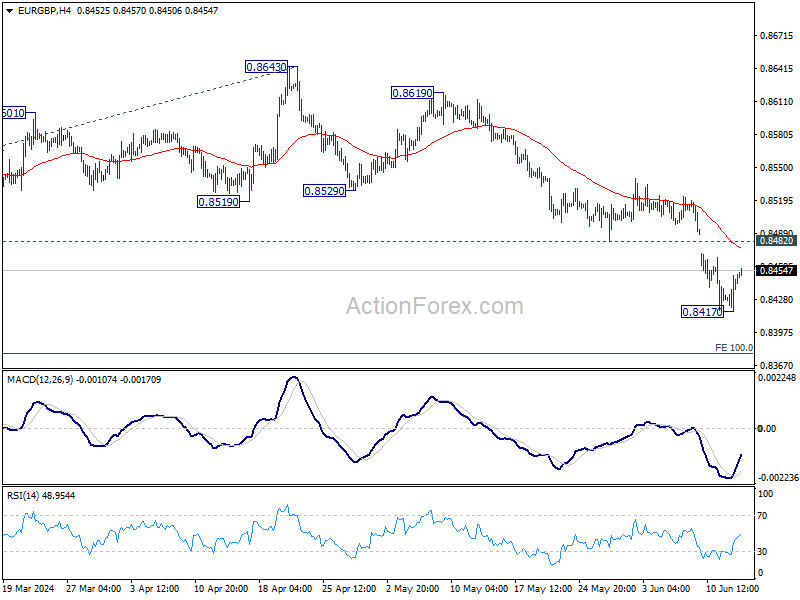
In the bigger picture, down trend from 0.9267 (2022 high) is in progress. Next target is 100% projection of 0.8764 to 0.8497 from 0.8643 at 0.8376. Sustained break there will target 161.8% projection at 0.8211 next. For now, outlook will remain bearish as long as 0.8643 resistance holds, even in case of stronger rebound.
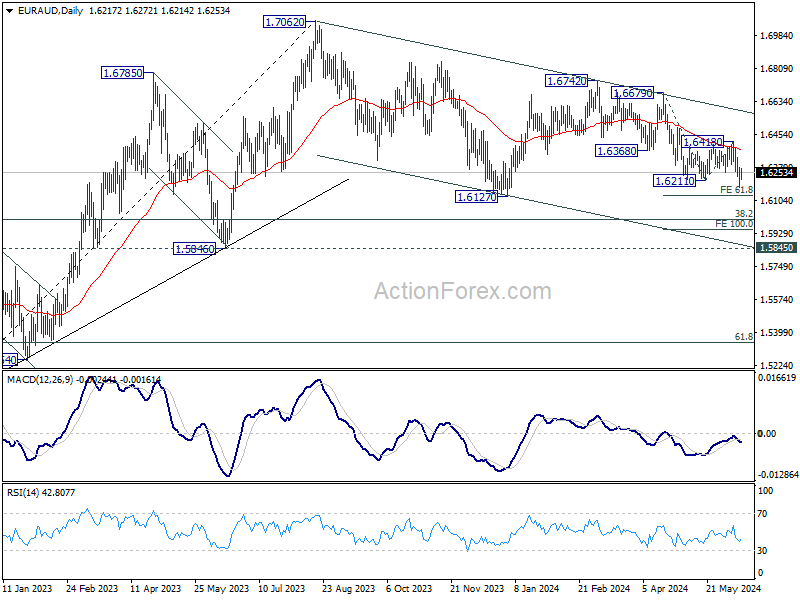
EUR/AUD Daily Outlook
Daily Pivots: (S1) 1.6167; (P) 1.6231; (R1) 1.6286; More...
EUR/AUD recovered after dipping to 1.6173 and intraday bias is turned neutral first. But outlook will stay bearish as long as 1.6418 resistance holds. Break of 1.6173 will resume the decline from 1.6742, as the third leg of the correction from 1.7062. Next target is 61.8% projection of 1.6679 to 1.6211 from 1.6418 at 1.6129.
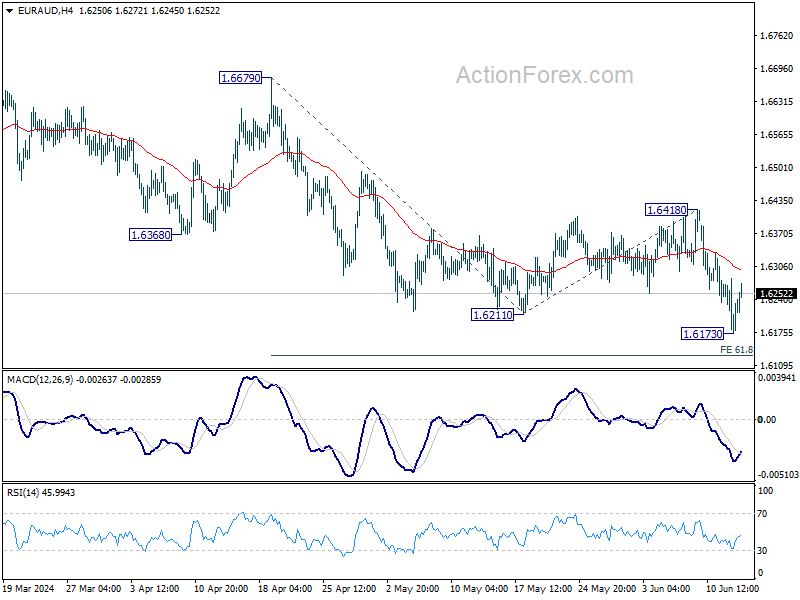
In the bigger picture, fall from 1.7062 medium term top is seen as a correction to the up trend from 1.4281 (2022 low). In case of deeper fall, strong support is expected around 1.5846 and 38.2% retracement of 1.4281 to 1.7062 at 1.6000 to bring rebound. Break of 1.7062 is in favor as a later stage.
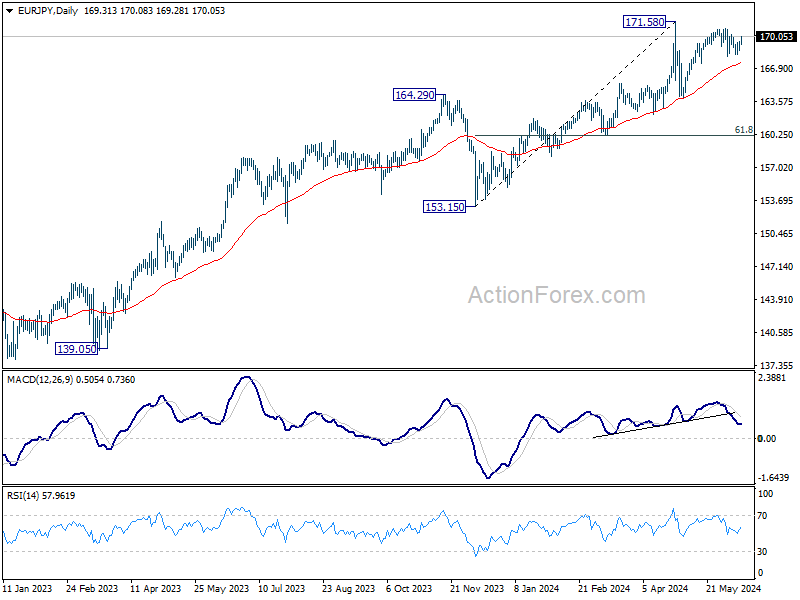
EUR/JPY Daily Outlook
Daily Pivots: (S1) 168.84; (P) 169.22; (R1) 169.78; More...
Intraday bias in EUR/JPY remains neutral for the moment. On the downside, break of 168.01 support will strengthen the case that rise from 164.31 has completed at 170.78 already. Intraday bias will be back on the downside for 167.31 support, and then 164.01. Nevertheless, break of 170.87 will resume the rally to retest 171.58 high instead.
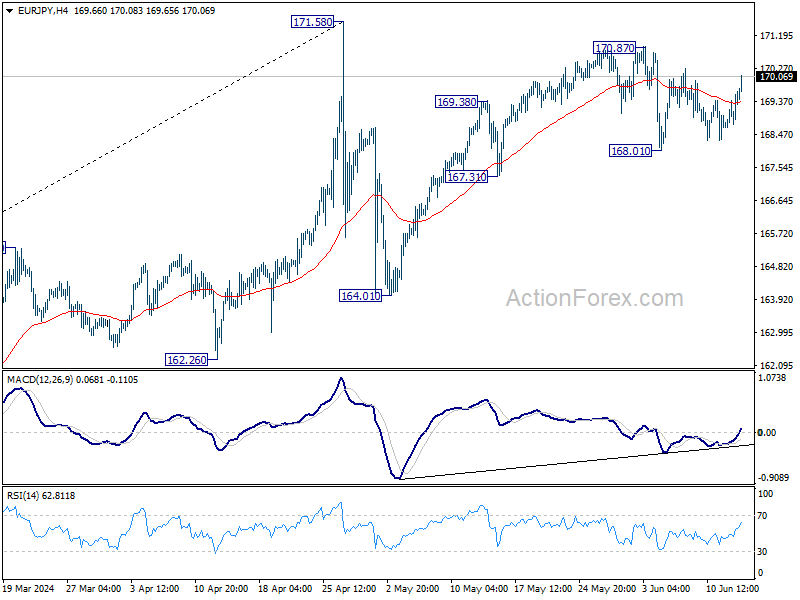
In the bigger picture, a medium top was formed at 171.58 after brief breach of 169.96 (2008 high). But as long as 55 W EMA (now at 159.51) holds, price actions from there is seen as correcting the rise from 153.15 only. That is, larger up trend remains in favor to continue. However, sustained break of 55 W EMA will argue that larger scale correction is underway and target 153.15 support.
GBP/JPY Daily Outlook
Daily Pivots: (S1) 199.96; (P) 200.46; (R1) 201.08; More...
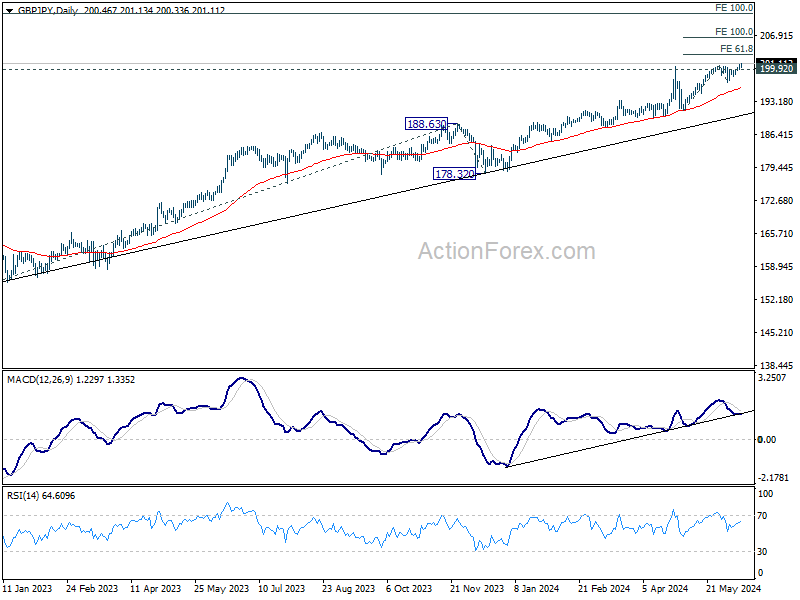
Intraday bias in GBP/JPY is back on the upside as up trend resumes. Next target is 61.8% projection of 191.34 to 200.72 from 197.18 at 202.97. On the downside, below 199.92 minor support will turn intraday bias neutral and bring consolidations first, before staging another rally.
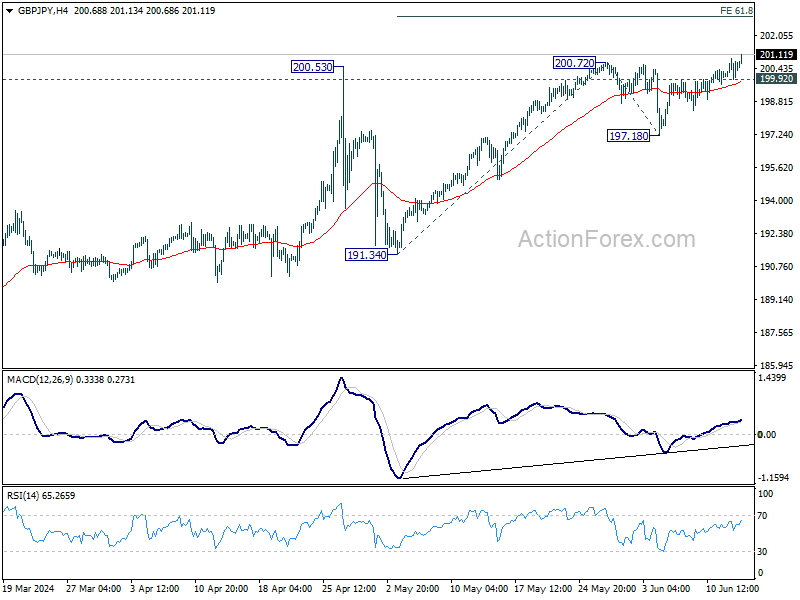
In the bigger picture, as long as 188.63 resistance turned support holds, long term up trend is expected to continue. Next target is 100% projection of 155.33 to 188.63 from 178.32 at 211.62.
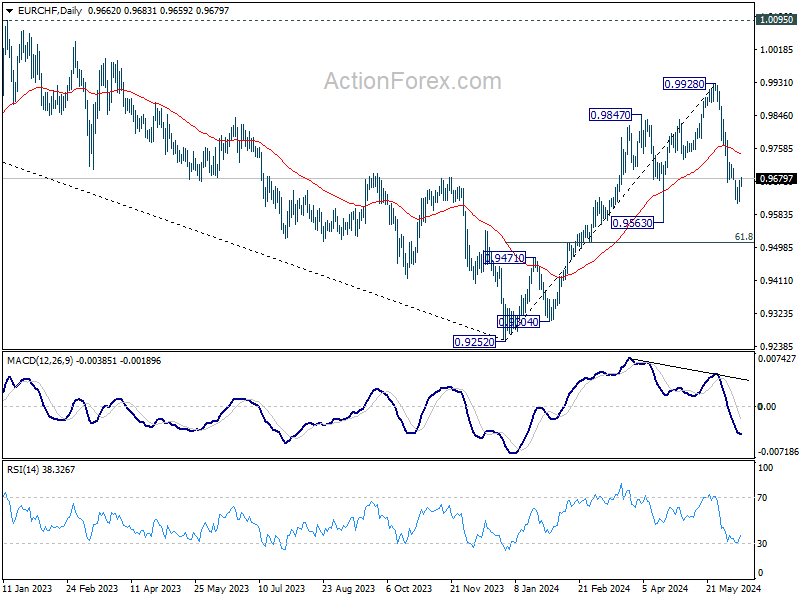
EUR/CHF Daily Outlook
Daily Pivots: (S1) 0.9633; (P) 0.9654; (R1) 0.9690; More....
Intraday bias in EUR/CHF is turned neutral with current recovery. Some consolidations could be seen, but another fall is expected as long as 55 D EMA (now at 0.9747) holds. Below 0.9613 will target 0.9563 support. Decisive break there will argue that whole rise from 0.9252 has completed, and bring deeper fall to 61.8% retracement of 0.9252 to 0.9928 at 0.9510.
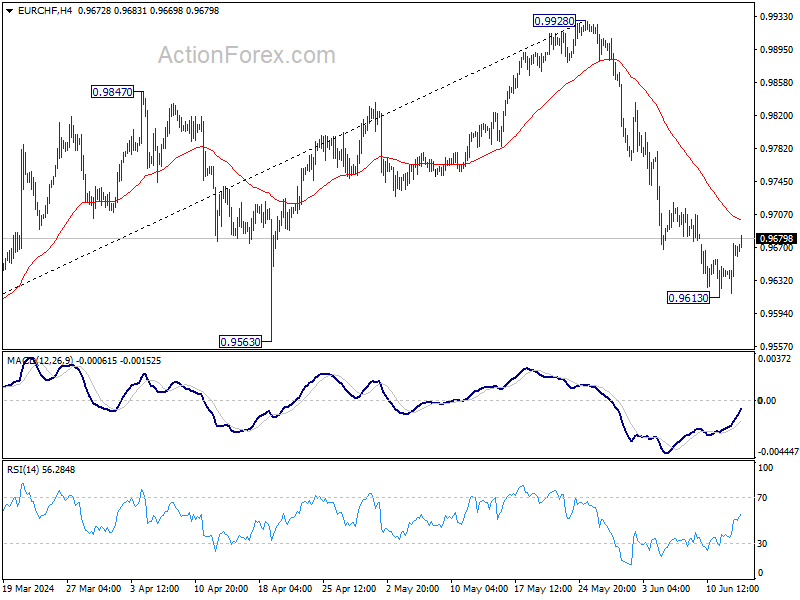
In the bigger picture, as long as 0.9563 support holds, rise from 0.9252 medium term bottom is still in favor to continue. Next target is 38.2% retracement of 1.2004 (2018 high) to 0.9252 (2023 low) at 1.0303, even just as a correction to the down trend from 1.2004. However, firm break of 0.9563 will suggest that the rally has completed and retain medium term bearishness.