
Sample Category Title
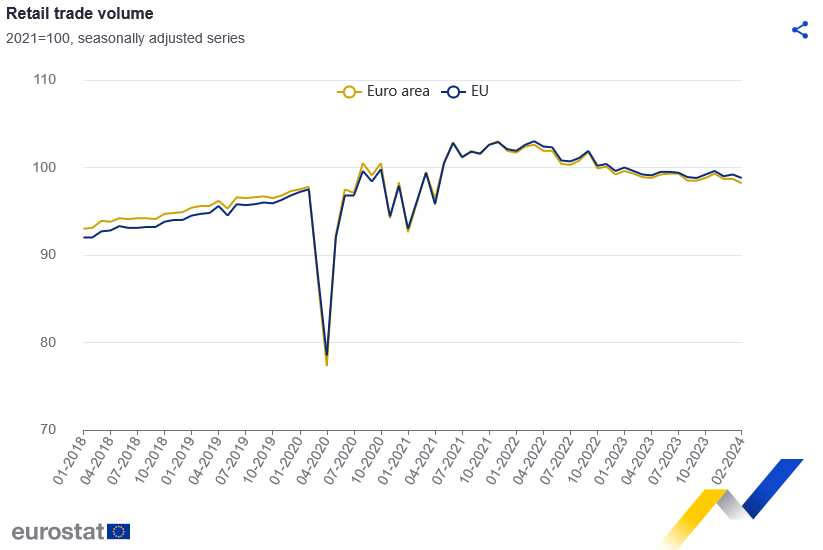
Eurozone retail sales falls -0.5% mom in Feb, EU down -0.4% mom
Eurozone retail sales volume fell -0.5% mom in February, worse than expectation of -0.3% mom. Volume of retail trade decreased for food, drinks, tobacco by -0.4% mom, non-food products (except automotive fuel) by -0.2% mom, automotive fuel in specialised stores by -1.4% mom.
EU retail sales fell volume -0.4% mom. Among Member States for which data are available, the largest monthly decreases in the total retail trade volume were recorded in Germany (-1.9%), Belgium (-1.8%) and Cyprus (-1.1%). The highest increases were observed in Poland (+1.4%), Croatia (+1.2%) and Estonia (+1.0%).
GBPJPY Trades Lower Ahead of Key Market Events
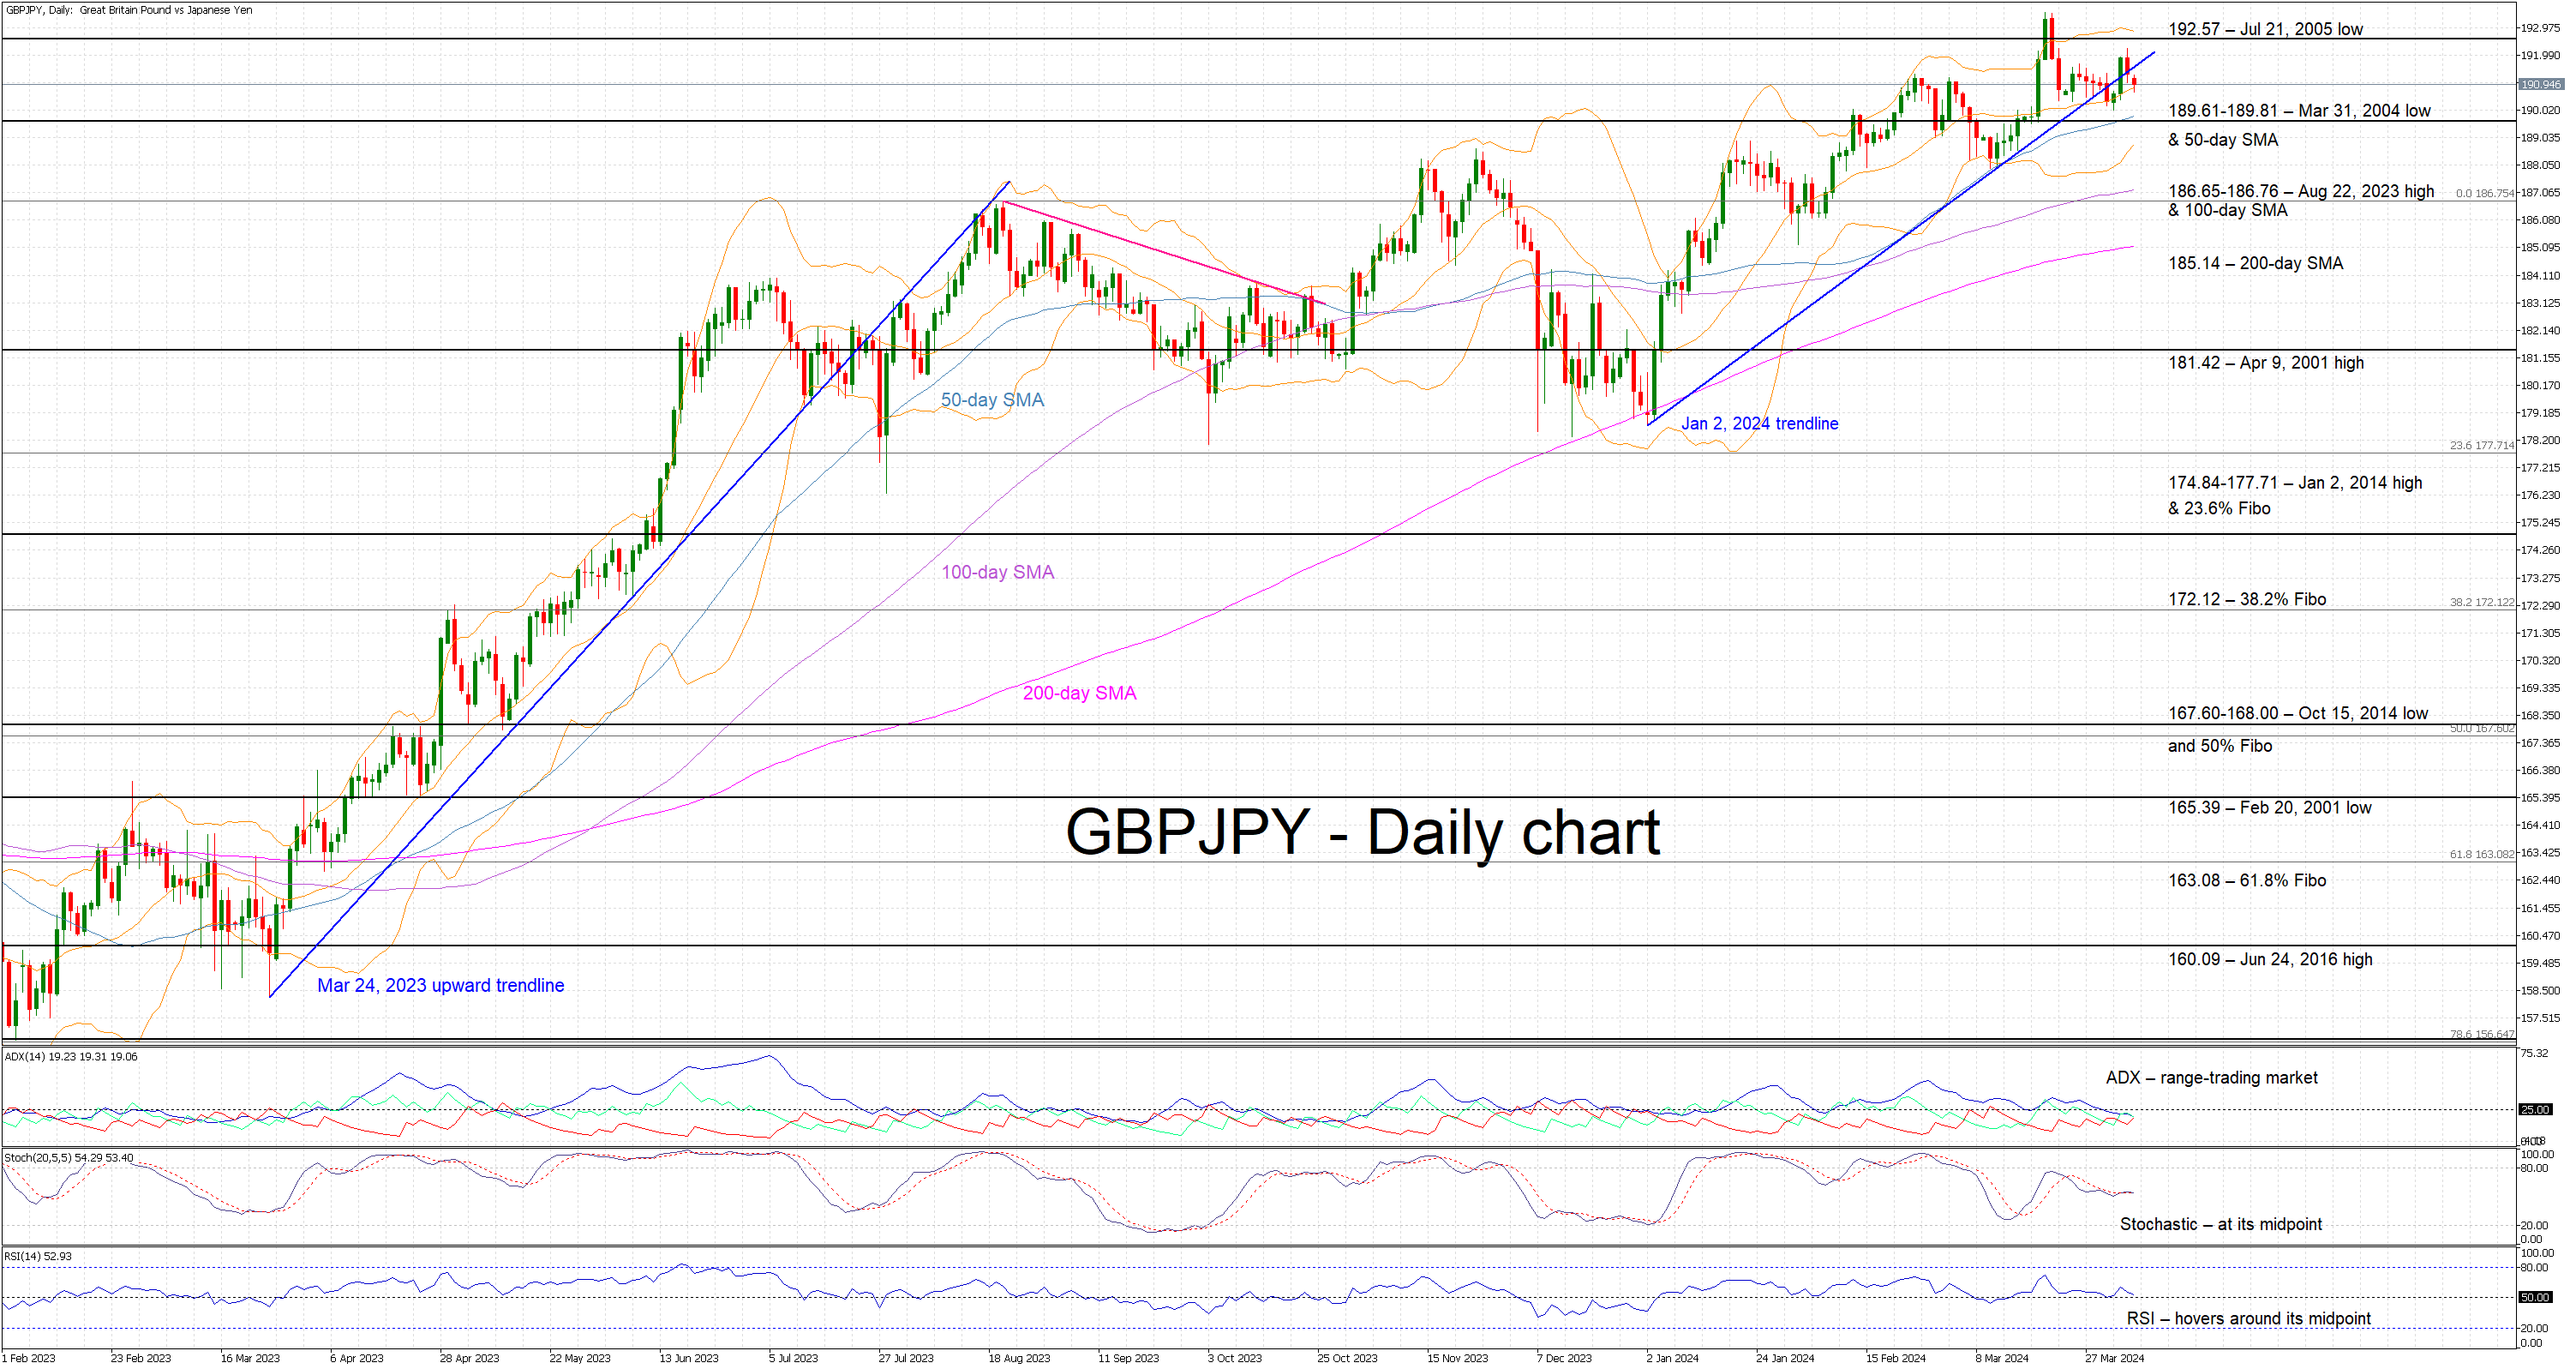
- GBPJPY is in the red again today, not far from its recent high
- It has dropped below the January 2, 2024 ascending trendline
- Momentum indicators are in waiting mode for the next key market events
GBPJPY is trading lower again today as the market is preparing for today’s US labour market report, which could play a key role in the Fed’s outlook. The move from the January 2, 2024 low has been aggressive despite the recent BoJ rate hike but the threat of intervention appears to have already borne fruit. However, the Japanese officials’ resolve could be really tested if another strong rally takes place soon.
In the meantime, the momentum indicators are clearly directionless and trendless. More specifically, the Average Directional Movement Index (ADX) remains stuck below its 25-threshold, signaling a range-trading market. Similarly, the RSI continues to hover around 50, confirming the current indecisiveness of market participants. More importantly, the stochastic oscillator is trading around its midpoint, pointing to a delicate balance in GBPJPY.
Should the bulls remain confident, they could try to lead GBPJPY back above the January 2, 2024 ascending trendline and test the resistance set by the July 21, 2005 low at 192.57. They could then have the chance to record a new 2024 high, above the current 193.52 high, with the next plausible target being in the 195.00 area.
On the other hand, the bears are desperate to regain market control and gradually push GBPJPY towards the 189.61-189.81 area, which is populated by the March 31, 2004 low and the 50-day simple moving average (SMA). If successful, they could then have a go at testing the support set by the busy 186.65-186.76 range that is defined by the August 22, 2023 high and the 100-day SMA.
To sum up, market participants are mostly on the sidelines ahead of the certain key market events with the GBPJPY bulls also trying to avoid further provoking the Japanese authorities.
USDCAD Ticks Higher Within Ascending Channel
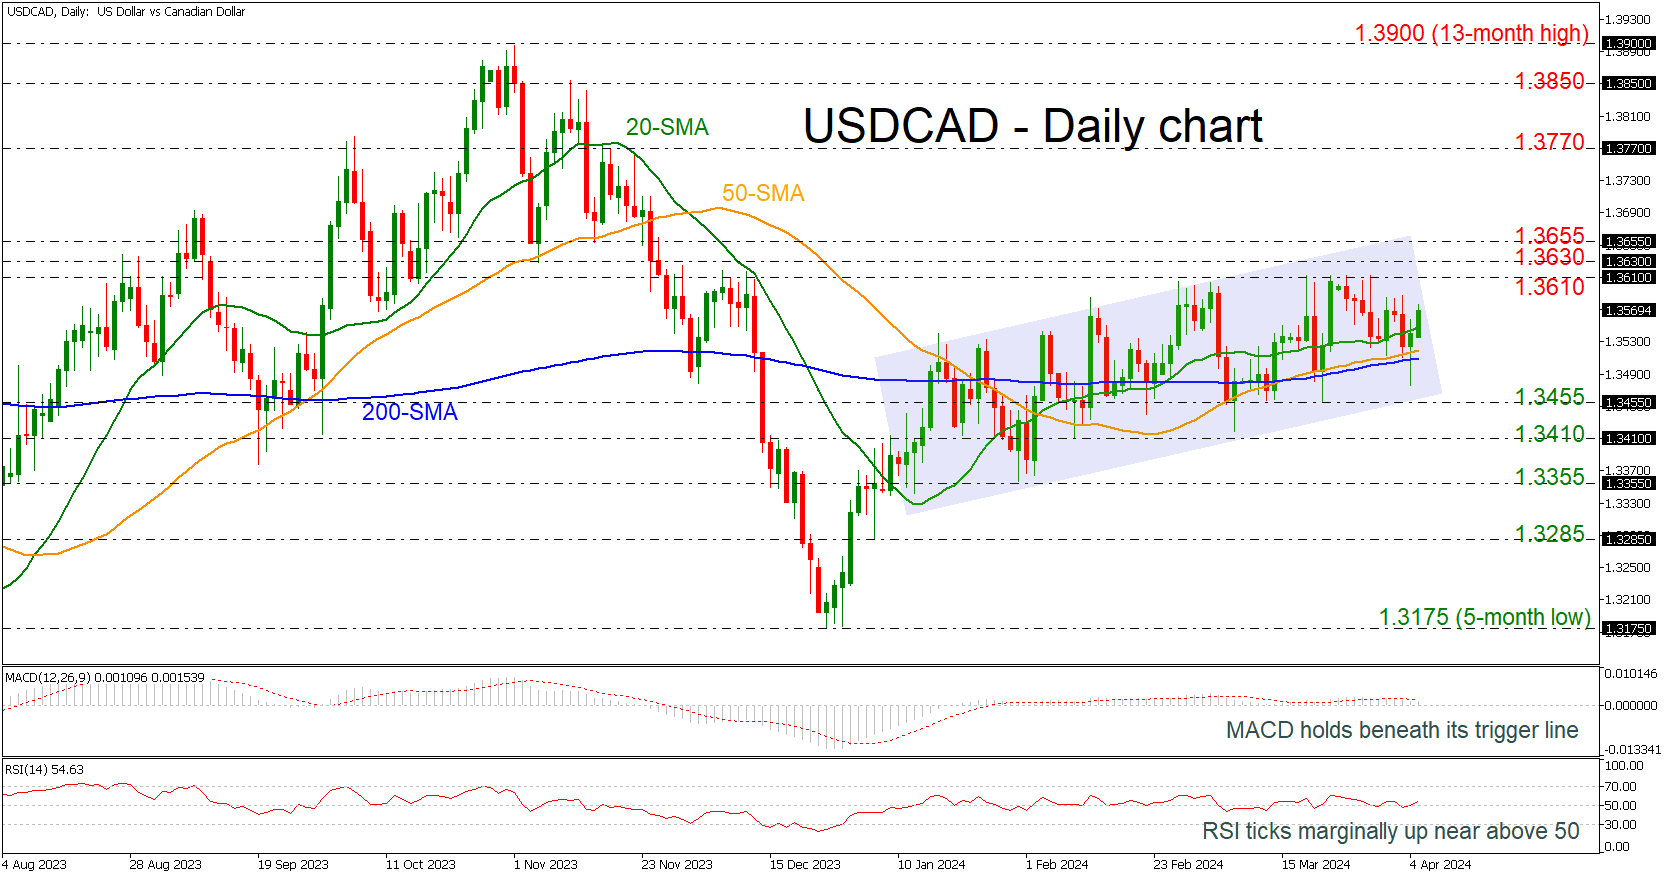
- USDCAD bounces off 200-day SMA
- MACD and RSI are still weak
USDCAD is moving slightly higher following the rebound off the simple moving averages (SMAs), remaining within a short-term ascending channel.
Technically, the MACD oscillator is holding beneath its trigger line and near the zero level, weakening its momentum, while the RSI is pointing marginally up above the neutral threshold of 50.
If the market extends its advance higher, then the restrictive region within 1.3610-1.3655 could halt bullish actions. However, a successful climb higher could endorse the bullish outlook, meeting the 1.3770 resistance, taken from the peak on November 16.
On the other hand, if the bears take control and slip beneath the 200-day SMA the pair could pause its downward move at 1.3455 ahead of 1.3410. A decline below the five-month low of 1.3175 could also switch the bias to a bearish one.
To conclude, USDCAD has been in a steady upward movement since January 9 but needs more of a boost to have a clear bullish trend.
GBP/JPY Daily Outlook
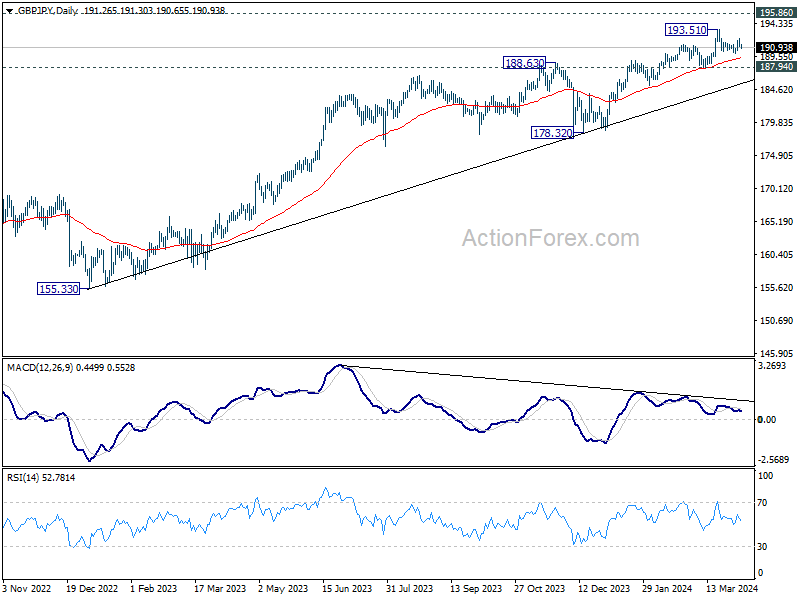
Daily Pivots: (S1) 190.82; (P) 191.54; (R1) 192.05; More.....
GBP/JPY retreated after brief rebound and intraday bias remains is turned neutral again. . For now, further rally is expected as long as 190.02 support holds, in case of retreat. Break of 193.51 will resume larger up trend.
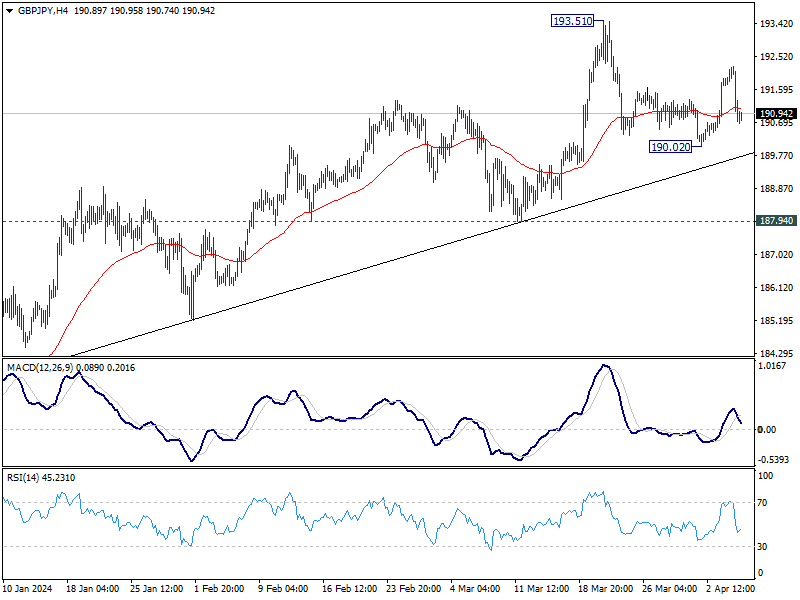
In the bigger picture, current rally is part of the up trend from 123.94 (2020 low), and is in progress for long term resistance (2015 high). Break of 187.94 support is needed to be the first sign of medium term topping. Otherwise, outlook will remain bullish in case of retreat.
EUR/JPY Daily Outlook
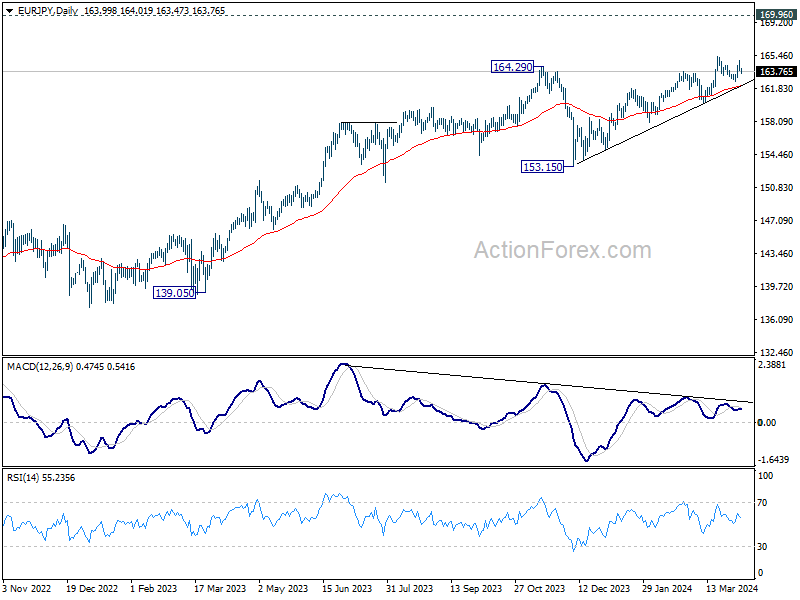
Daily Pivots: (S1) 163.56; (P) 164.24; (R1) 164.69; More...
Intraday bias in EUR/JPY as turned neutral again as it retreated ahead of 165.33 resistance. Further rally will remain in favor as long as 162.59 support holds, in case of retreat. Break of 165.33 will resume larger up trend.
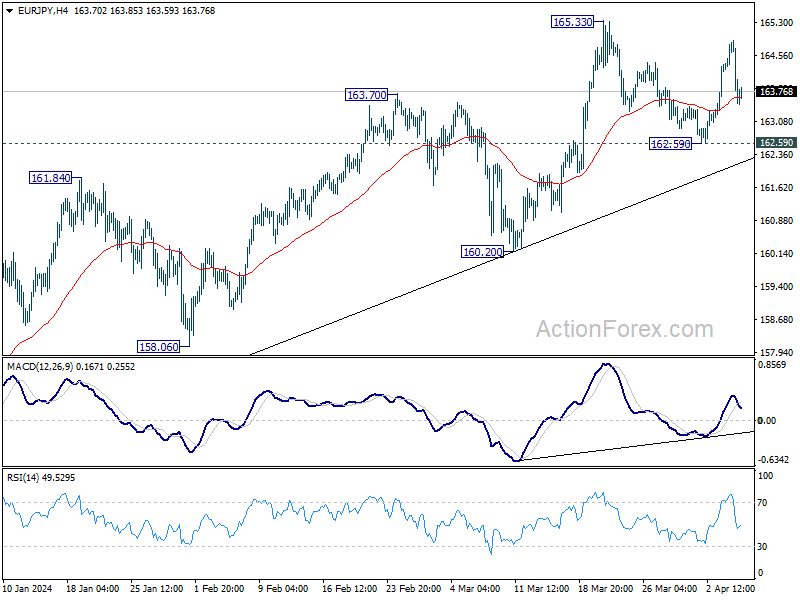
In the bigger picture, current rally is part of the up trend from 114.42 (2020 low), which is still in progress. Next target is 169.96 (2008 high). Break of 160.20 support is needed to be the first sign of medium term topping. Otherwise, outlook will stay bullish in case of retreat.
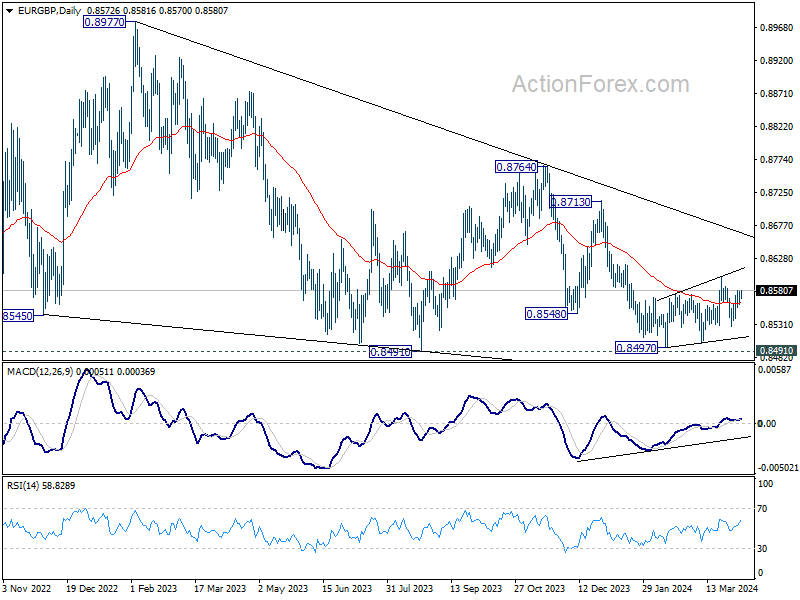
EUR/GBP Daily Outlook
Daily Pivots: (S1) 0.8562; (P) 0.8572; (R1) 0.8581; More...
EUR/GBP is still bounded in range below 0.8601 and intraday bias remains neutral. On the downside, firm break of 0.8529 support will argue that the corrective recovery from 0.8497 has completed at 0.8601. Intraday bias will be back on the downside for retesting 0.8497 low next. On the upside, break of 0.8601 will resume the rebound instead.
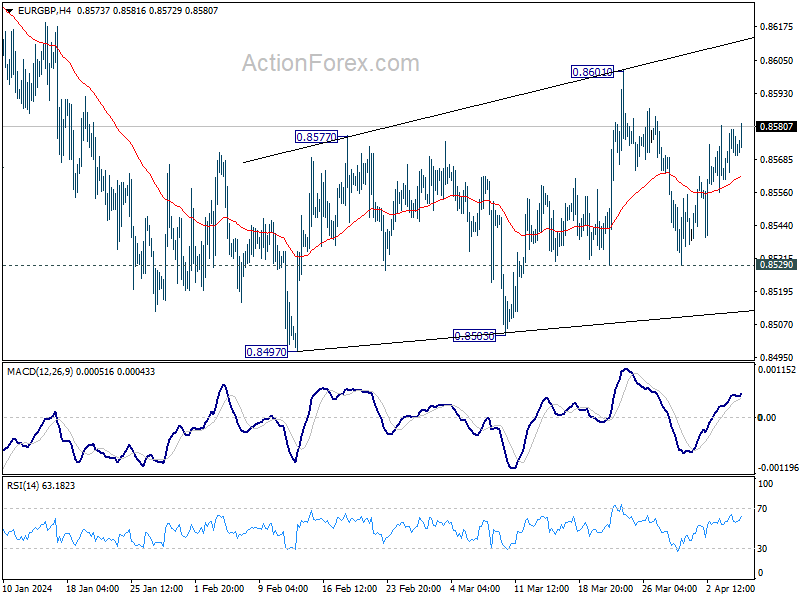
In the bigger picture, there is no clear sign that down trend from 0.9267 has completed, despite loss of downside momentum as seen in D MACD. As long as 0.8713 resistance holds, the down trend will remain in favor to resume through 0.8491 low at la later stage.
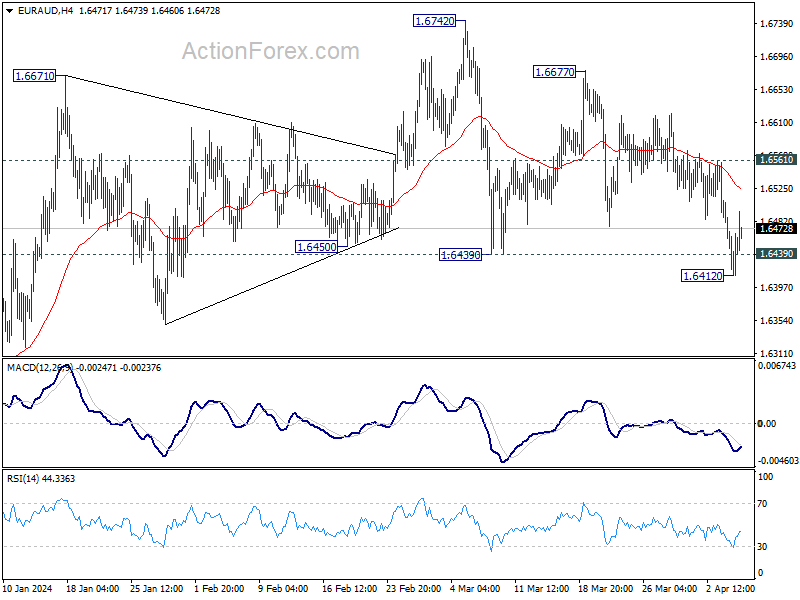
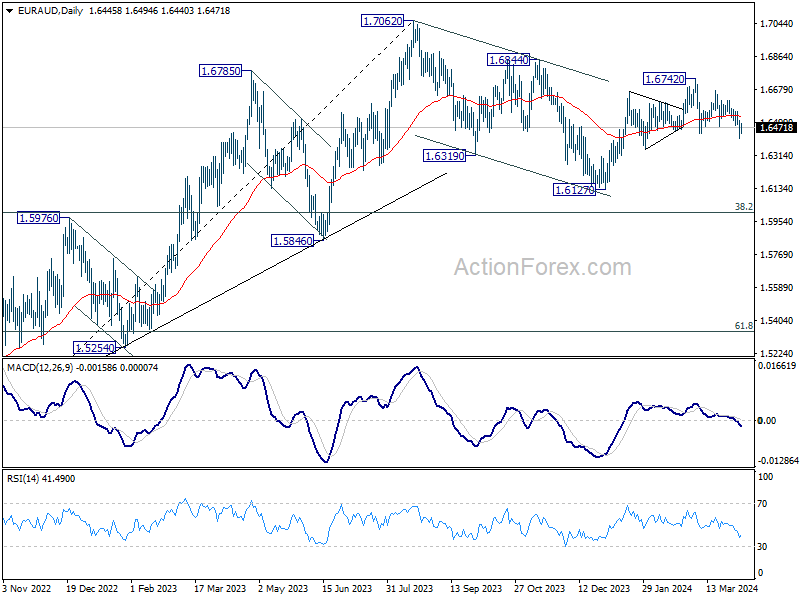
EUR/AUD Daily Outlook
Daily Pivots: (S1) 1.6404; (P) 1.6460; (R1) 1.6506; More..
EUR/AUD recovered after dipping to 1.6412 briefly and intraday bias stays neutral. On the downside, break of 1.6412 and sustained trading below 1.6439 support will argue that whole rebound from 1.6127 has completed, and turn near term outlook bearish for this support again. Nevertheless, strong rebound from current level, followed by break of 1.6561 minor resistance, will turn bias back to the upside for retesting 1.6742.
In the bigger picture, fall from 1.7062 medium term top is seen as a correction to the up trend from 1.4281 (2022 low). Break of 1.6844 resistance will argue that this up trend is ready to resume through 1.7062 high. In case of another fall, strong support should be seen around 1.5846 and 38.2% retracement of 1.4281 to 1.7062 at 1.6000 to bring rebound.
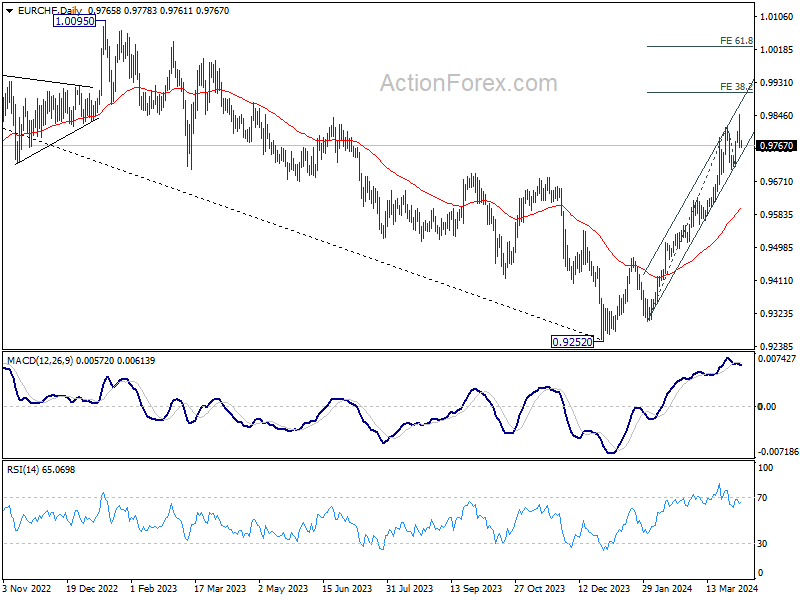
EUR/CHF Daily Outlook
Daily Pivots: (S1) 0.9738; (P) 0.9794; (R1) 0.9825; More...
EUR/CHF retreated notably after edging higher to 0.9847 and intraday bias is turned neutral. On the upside, above 0.9847 will resume the rally from 0.9252 to 38.2% projection of 0.9304 to 0.9818 from 0.9709 at 0.9905. However, considering bearish divergence condition in 4H MACD, break of 0.9709 will confirm short term topping, and turn bias back to the downside for deeper pullback.
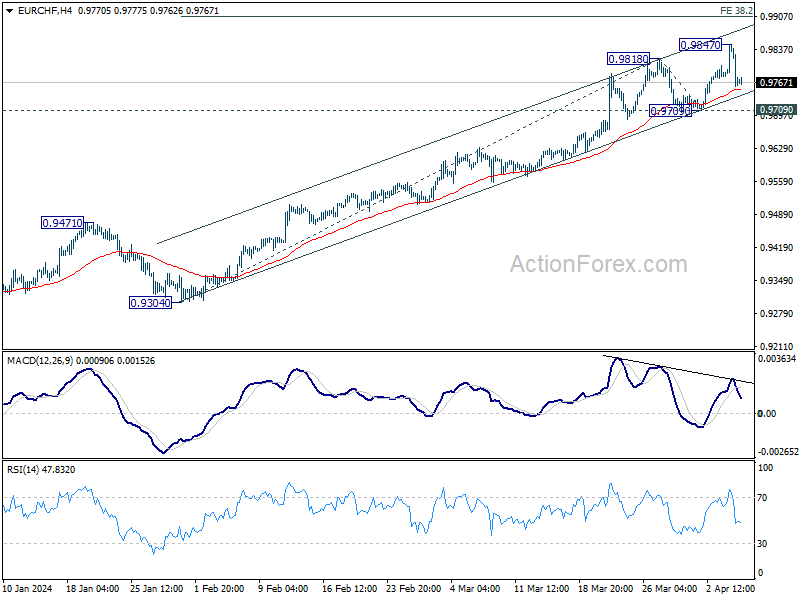
In the bigger picture, a medium term bottom should be in place at 0.9252 already, on bullish convergence condition in W MACD. Rise from there would now target 38.2% retracement of 1.2004 (2018 high) to 0.9252 (2023 low) at 1.0303, even as a correction to the down trend from 1.2004. This will remain the favored case as long as 55 D EMA (now at 0.9599) holds.
Cliff Notes: Marking Time
Key insights from the week that was.
Beginning in Australia, the RBA March Minutes revealed important developments in the considerations for, and operational framework around, monetary policy. On the former, it appears the RBA Board did not discuss the case for a rate hike in March, focusing solely on the case to remain on hold. That is a departure from this cycle’s common practice of considering multiple policy options at each meeting. The change in rhetoric was relatively marginal, however. The Board continues to recognise that, amid the currently restrictive policy environment, inflation is decelerating as demand and supply come into balance; that said, the Board needs more confidence in inflation’s sustainable return to target before debating the timing and scale of policy easing. We remain of the view that the Board will have this confidence by September, allowing the RBA to embark on a measured rate cutting cycle, 25bps per quarter to 3.10% in Q3 2025.
This week, Chief Economist Luci Ellis also discussed the RBA’s change to operational arrangements for monetary policy. The Board have decided to implement a regime of ‘ample reserves’ as the means of controlling the cash rate, similar to what is currently used by the Bank of England and ECB. This regime should still provide protection against the risk of sudden declines in exchange settlement balances compared to the pre-pandemic ‘scarce reserves’ regime; but, in the context of already-declining liquidity – as unconventional monetary policies are unwound – a regime of ‘ample reserves’ implies lower risks of market distortions than the pandemic-era ‘excess reserves’ regime. Overall, these changes are purely operational and have no implications for the stance of monetary policy.
This week’s updates on housing were a little murkier than usual. Headline (non-seasonally adjusted) figures from CoreLogic’s home value index suggest that house price momentum has improved since the turn of the year (0.2% in Dec to 0.6% in Mar). However, on our figuring, momentum in seasonally adjusted terms imply the opposite, with gains decelerating over recent months (0.5% in Dec to 0.3% in Mar). At the same time, the total volume of dwelling approvals look to be cycling lower still in 2024 (–5.8%yr) after spending much of 2023 near pandemic-era lows. While seasonal issues across both sets of data are making it more difficult to judge the underlying trend, it remains clear that Australia’s residential construction pipeline has shrunk significantly and, consequently, that tight housing supply will remain an underlying support for prices into the medium-term.
In the US meanwhile, the ISM manufacturing index rose 2.5pts while the non-manufacturing index fell 1.2pts. Both remain below their long-run averages. The sub-indices suggest conditions will shortly warrant policy easing. Both price sub-indices are now below long-run averages – periods over which inflation was low and stable. Although the employment sub-indices firmed in March, they remain at levels consistent with aggregate job loss. Regional indicators of employment and investment also suggest businesses are increasingly becoming cautious on the outlook. Note the March employment situation report is due tonight and the March CPI will follow next week.
Over in Europe, inflation eased to 2.4%yr in March, undershooting expectations of both the European Central Bank and market participants. However, services inflation remained sticky at 4.0%yr and now accounts for around 70% of total inflation. As goods inflation bottoms out, services inflation will have to soften to keep aggregate inflation near the 2.0%yr target.
AUD/USD and NZD/USD Remain In Uptrend
AUD/USD is correcting gains from the 0.6620 zone. NZD/USD is also moving lower and might attempt a fresh increase from 0.6000.
Important Takeaways for AUD USD and NZD USD Analysis Today
- The Aussie Dollar started a downside correction from 0.6620 against the US Dollar.
- There is a key bullish trend line forming with support at 0.6550 on the hourly chart of AUD/USD at FXOpen.
- NZD/USD is also moving lower below the 0.6030 support zone.
- There is a major bullish trend line forming with support at 0.5995 on the hourly chart of NZD/USD at FXOpen.
AUD/USD Technical Analysis
On the hourly chart of AUD/USD at FXOpen, the pair started a fresh increase from the 0.6480 support. The Aussie Dollar was able to clear the 0.6535 resistance to move into a positive zone against the US Dollar.
There was a close above the 0.6550 resistance and the 50-hour simple moving average. Finally, the pair tested the 0.6620 zone. A high was formed near 0.6619 and the pair is now correcting gains.
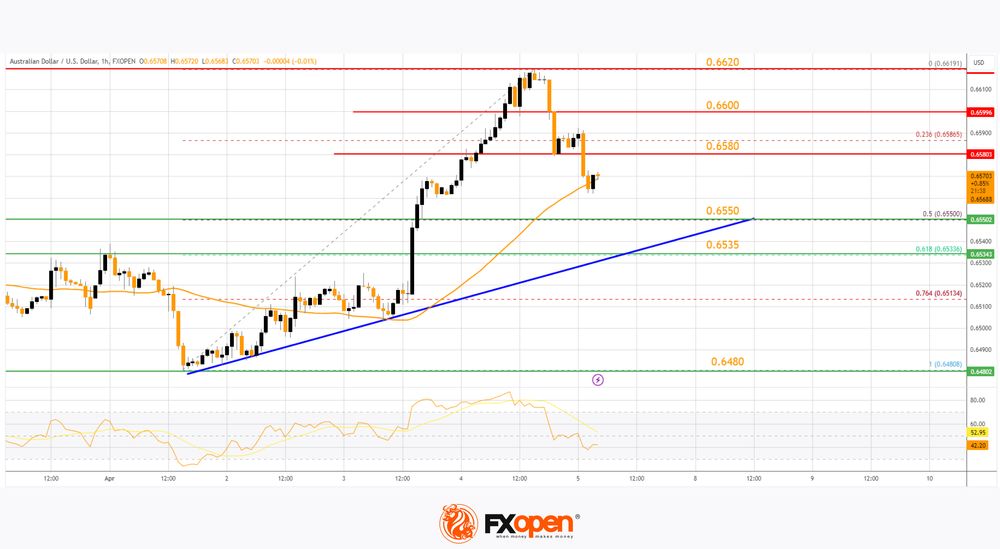
There was a move below the 0.6600 level. The pair declined below the 23.6% Fib retracement level of the upward move from the 0.6480 swing low to the 0.6619 high. On the downside, initial support is near the 50% Fib retracement level of the upward move from the 0.6480 swing low to the 0.6619 high at 0.6550.
There is also a key bullish trend line forming with support at 0.6550. The next support could be 0.6535. If there is a downside break below the 0.6535 support, the pair could extend its decline toward the 0.6480 level. Any more losses might signal a move toward 0.6440.
On the upside, the AUD/USD chart indicates that the pair is now facing resistance near 0.6580. The first major resistance might be 0.6600. An upside break above the 0.6600 resistance might send the pair further higher.
The next major resistance is near the 0.6620 level. Any more gains could clear the path for a move toward the 0.6650 resistance zone.
NZD/USD Technical Analysis
On the hourly chart of NZD/USD on FXOpen, the pair started a steady increase from the 0.5940 level. The New Zealand Dollar broke the 0.6000 resistance to start the recent increase against the US Dollar.
The pair settled above 0.6000 and the 50-hour simple moving average. It tested the 0.6050 zone and is currently correcting gains. The pair corrected lower below the 0.6030 level. The pair also traded below the 23.6% Fib retracement level of the upward wave from the 0.5939 swing low to the 0.6046 high.
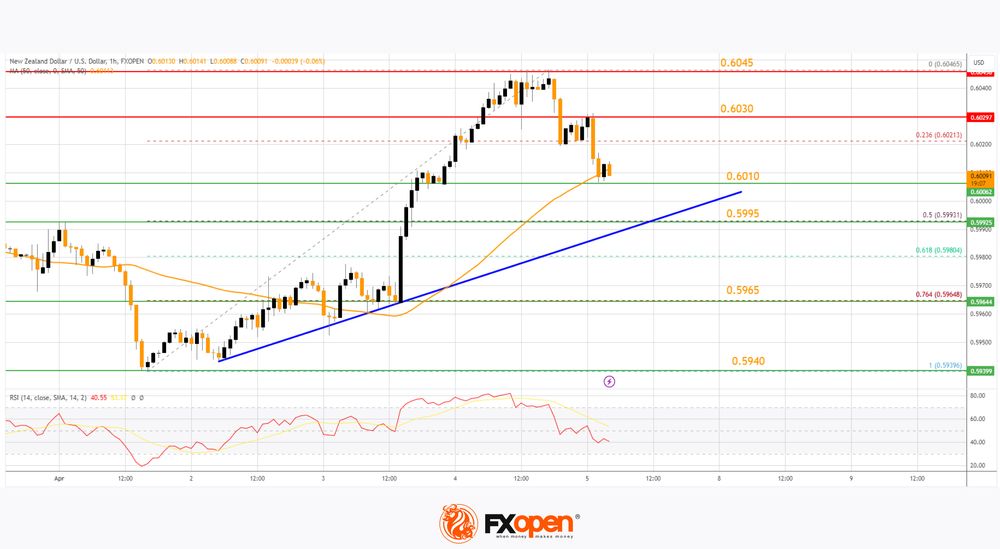
The NZD/USD chart suggests that the RSI is still below 50 and signaling more downsides. On the downside, there is major support forming near 0.6010.
The next major support is near the 50% Fib retracement level of the upward wave from the 0.5939 swing low to the 0.6046 high at 0.5995. There is also a major bullish trend line forming with support at 0.5995.
If there is a downside break below the 0.5995 support, the pair might slide toward the 0.5965 support. Any more losses could lead NZD/USD in a bearish zone to 0.5940.
On the upside, the pair might struggle near 0.6030. The next major resistance is near the 0.6045 level. A clear move above the 0.6045 level might even push the pair toward the 0.6080 level. Any more gains might clear the path for a move toward the 0.6120 resistance zone in the coming days.
Trade over 50 forex markets 24 hours a day with FXOpen. Take advantage of low commissions, deep liquidity, and spreads from 0.0 pips. Open your FXOpen account now or learn more about trading forex with FXOpen.
This article represents the opinion of the Companies operating under the FXOpen brand only. It is not to be construed as an offer, solicitation, or recommendation with respect to products and services provided by the Companies operating under the FXOpen brand, nor is it to be considered financial advice.