Sample Category Title
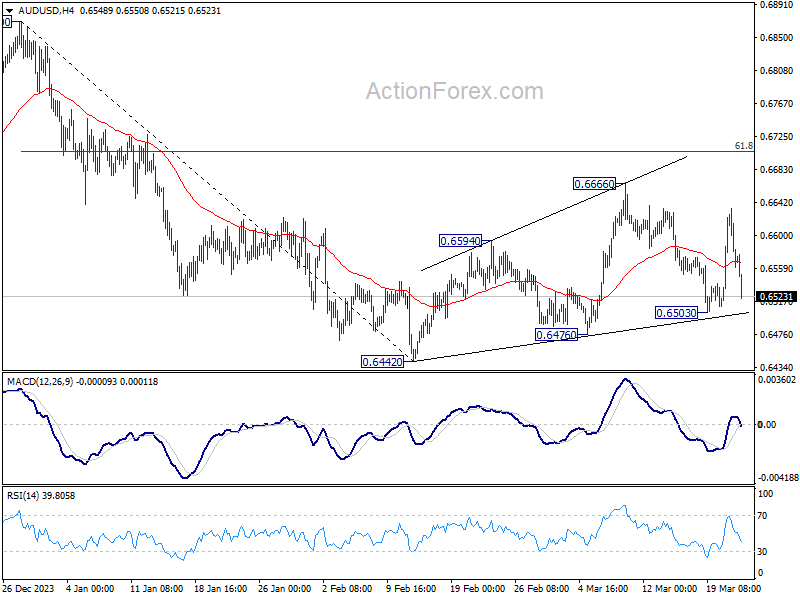
AUD/USD Daily Report
Daily Pivots: (S1) 0.6542; (P) 0.6589; (R1) 0.6616; More...
Intraday bias in AUD/USD remains neutral first as range trading continues inside 0.6503/6666. On the downside, break of 0.6503 will indicate that larger fall from 0.6870 is ready to resume, and turn bias to the downside for 0.6442 low. On the upside, break of 0.6666 will resume the rise from 0.6442 to 61.8% retracement of 0.6870 to 0.64420 at 0.6707.
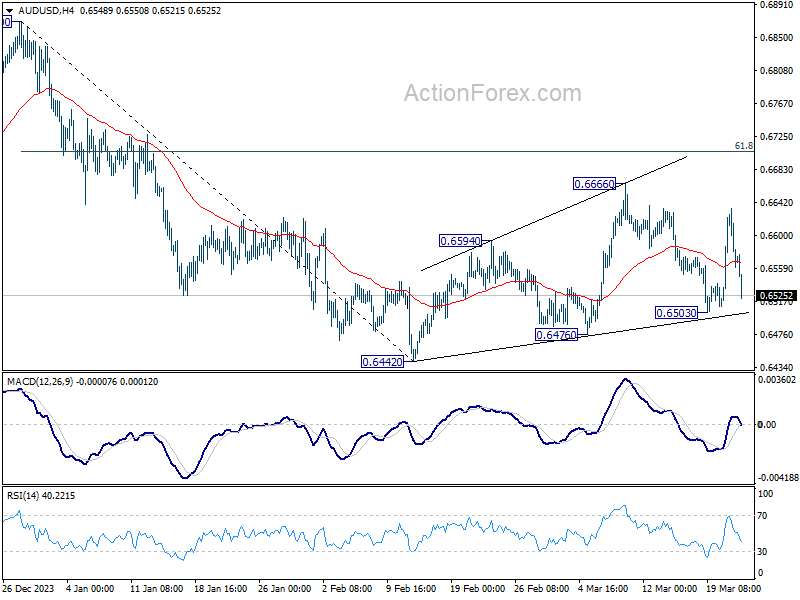
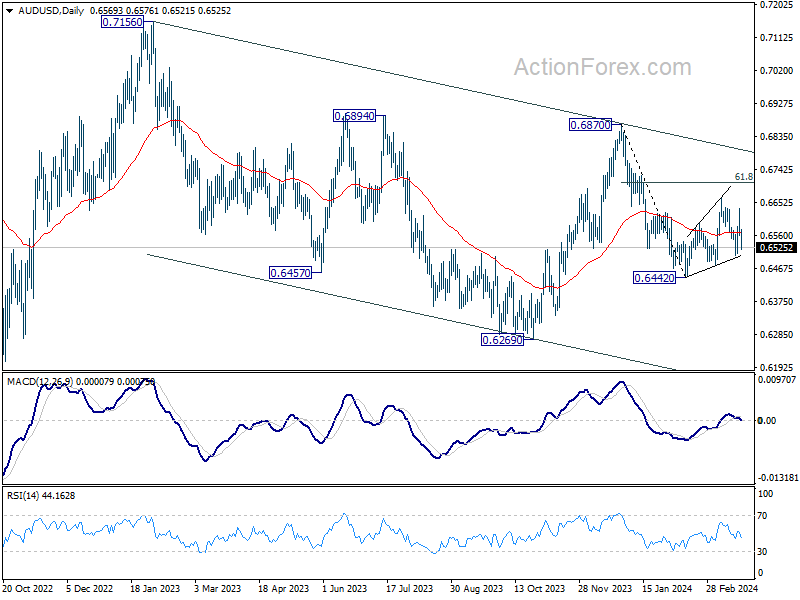
In the bigger picture, price actions from 0.6169 (2022 low) are seen as a medium term corrective pattern to the down trend from 0.8006 (2021 high). Fall from 0.7156 (2023 high) is seen as the second leg, which might still be in progress. Overall, sideway trading could continue in range of 0.6169/7156 for some more time. But as long as 0.7156 holds, an eventual downside breakout would be mildly in favor.
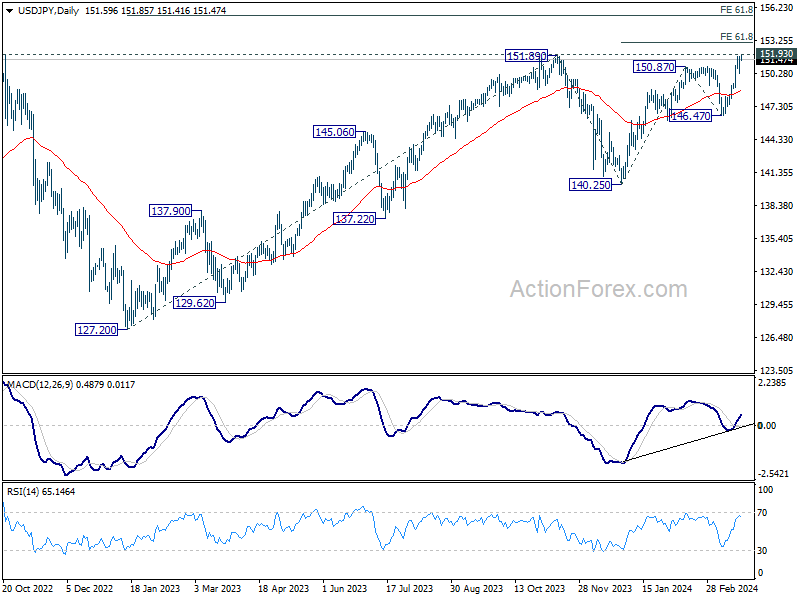
USD/JPY Daily Outlook
Daily Pivots: (S1) 150.69; (P) 151.22; (R1) 152.18; More...
Intraday bias in USD/JPY stays neutral as consolidation from 151.82 temporary top might extend. But further rally is expected as long as 55 4H EMA (now at 149.91) holds. On the upside, decisive break of 151.93 key resistance will confirm long term up trend resumption. Next near term target will be 61.8% projection of 140.25 to 150.87 from 146.47 at 153.03. However, sustained trading below 55 4H EMA will bring deeper fall back to 146.47 support instead.
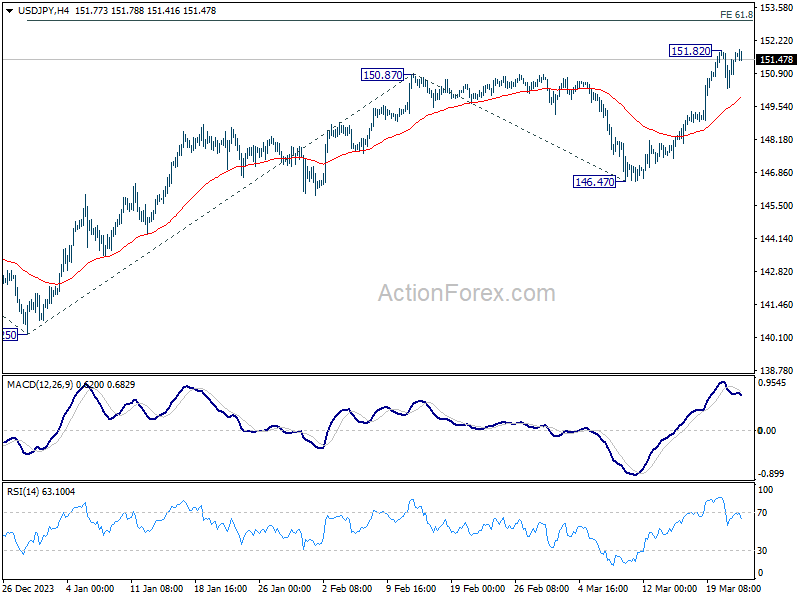
In the bigger picture, correction from 151.87 (2023) high could have completed at 140.25 already. Rise from 127.20 (2023 low), as part of the long term up trend, is probably ready to resume. Decisive break of 151.93 resistance (2022 high) will confirm this bullish case. Next medium term target will be 61.8% projection of 127.20 to 151.89 from 140.25 at 155.20. This will remain the favored case as long as 146.47 support holds, in case of another pullback.
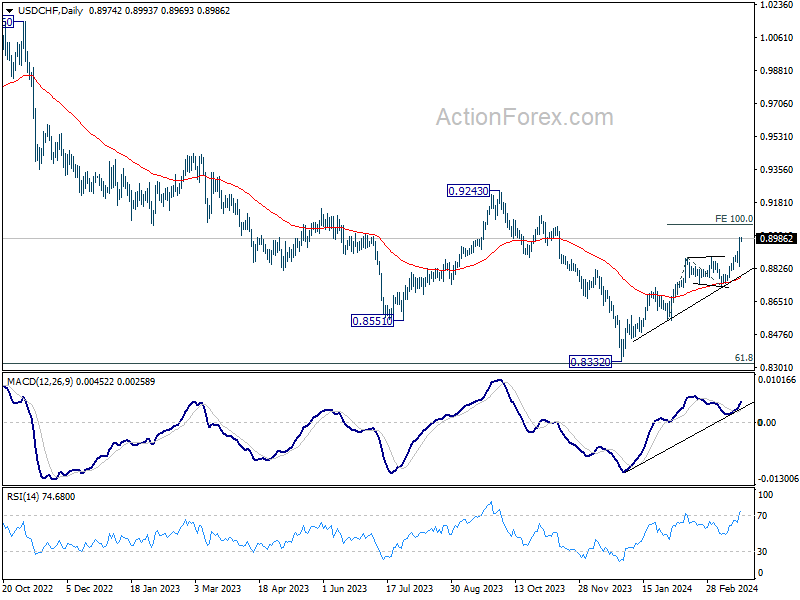
USD/CHF Daily Outlook
Daily Pivots: (S1) 0.8878; (P) 0.8936; (R1) 0.9033; More....
Intraday bias in USD/CHF remains on the upside at this point. Current rally from 0.8332 is in progress for 100% projection projection of 0.8550 to 0.8884 from 0.8728 at 0.9062. On the downside, below 0.8922 minor support will turn intraday bias neutral again. But, outlook will remain bullish as long as 0.8728 support holds.
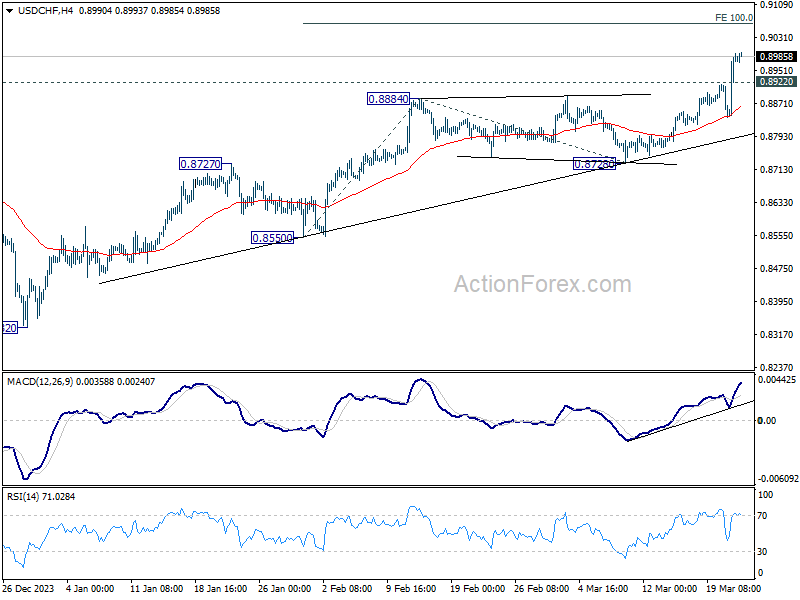
In the bigger picture, price actions from 0.8332 medium term bottom as seen as developing into a corrective pattern to the down trend from 1.0146 (2022 high). Further rise would be seen as long as 0.8555 support holds. But upside should be limited by 0.9243 resistance, at least on first attempt.
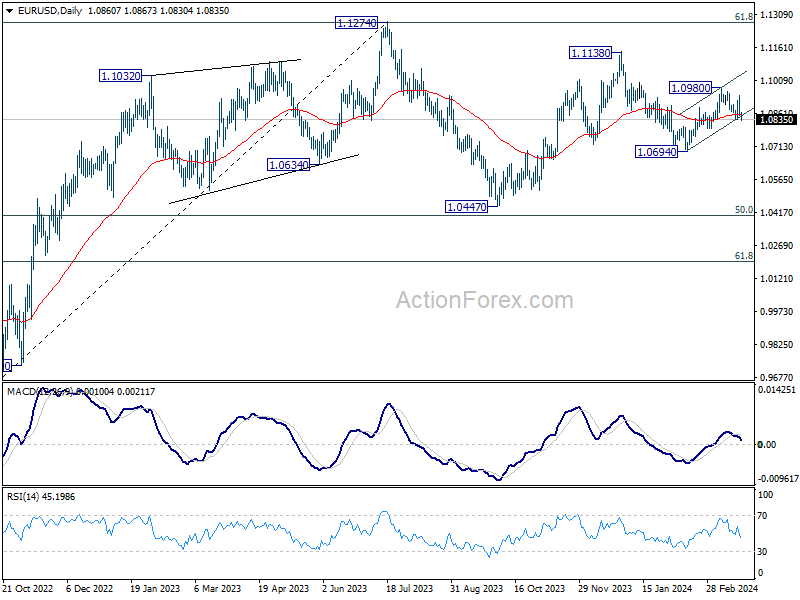
EUR/USD Daily Outlook
Daily Pivots: (S1) 1.0830; (P) 1.0886; (R1) 1.0917; More...
Intraday bias in EUR/USD is back on the downside with current steep fall and break of 1.0834 support. Sustained trading below 55 D EMA (now at 1.0861) will argue that rebound from 1.0694 has completed and bring retest of this low. For now, risk will stay on the downside as long as 1.0941 resistance holds, in case of recovery.
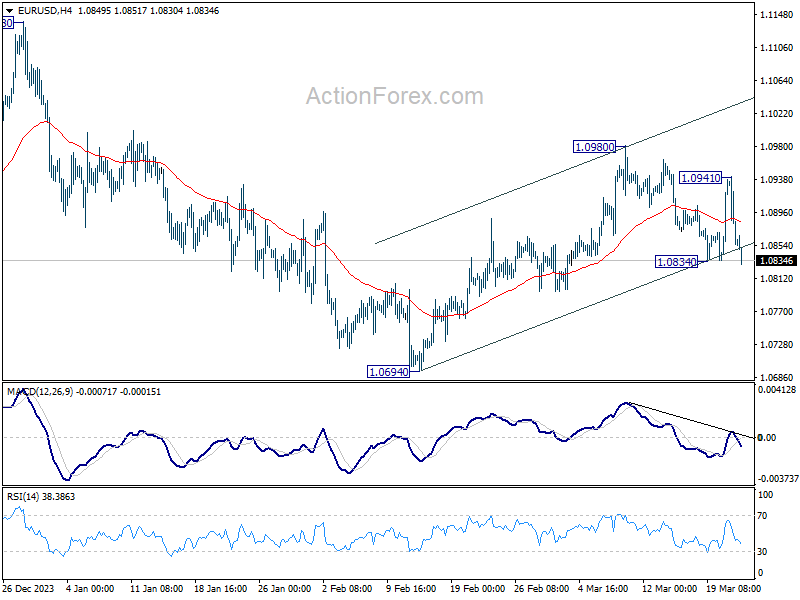
In the bigger picture, price actions from 1.1274 are viewed as a corrective pattern to rise from 0.9534 (2022 low). Rise from 1.0447 is seen as the second leg. While further rally could cannot be ruled out, upside should be limited by 1.1274 to bring the third leg of the pattern. Meanwhile, sustained break of 1.0694 support will argue that the third leg has already started for 1.0447 and possibly below.
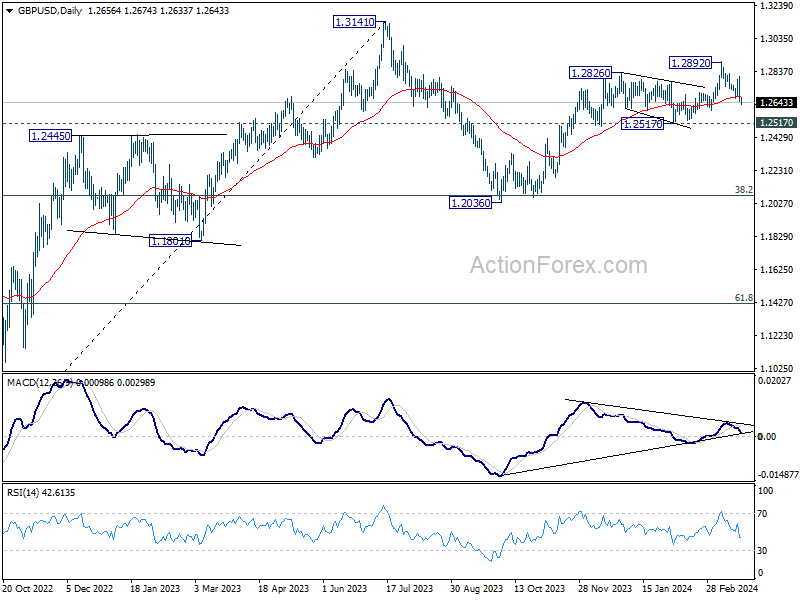
GBP/USD Daily Outlook
Daily Pivots: (S1) 1.2605; (P) 1.2704; (R1) 1.2757; More...
GBP/USD's steep decline and break of 1.2666 support indicates resumption of fall from 1.2892. Intraday bias is back on the downside for 1.2517 structural support next. Decisive break there will indicate larger bearish reversal. For now, risk will remain on the downside as long as 1.2802 resistance holds, in case of recovery.
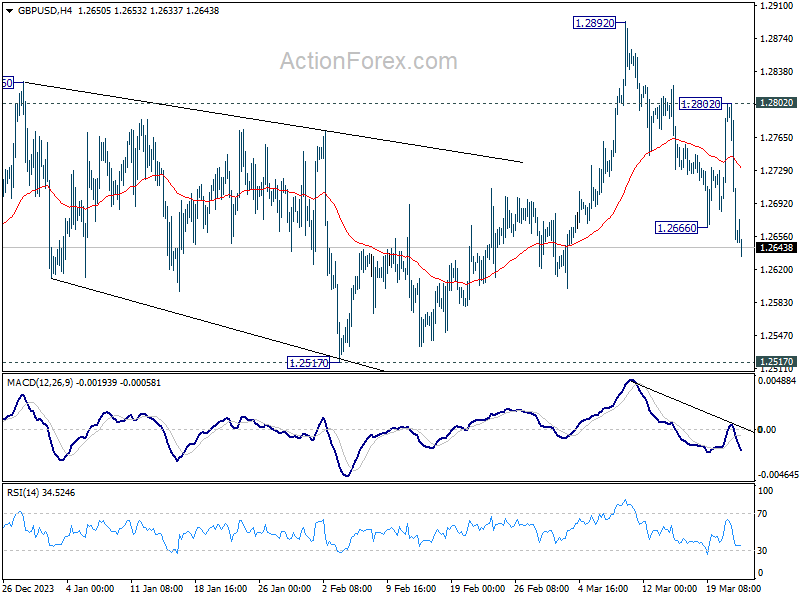
In the bigger picture, price actions from 1.3141 medium term top are seen as a corrective pattern to up trend from 1.0351 (2022 low). Rise from 1.2036 is seen as the second leg, which is still in progress. But upside should be limited by 1.3141 to bring the third leg of the pattern. Meanwhile, break of 1.2517 support will argue that the third leg has already started for 38.2% retracement of 1.0351 (2022 low) to 1.3141 at 1.2075 again.
Dollar Strikes Back as Investors Reevaluate Global Central Bank Paths
Dollar mounted a significant comeback overnight, demonstrating resilience amidst surge in risk-on sentiment that propelled the three major US stock indexes to record highs. The greenback continued to extend gains in Asian session, surpassing pre-FOMC highs against European majors.
The shift in sentiment came in wake of SNB's unexpected rate cut yesterday and dovish voting pattern from BoE. These events could have led investors to realize that there are realistic risks that Fed could start cutting interest rates later other major counterparts like ECB.
Currently, Dollar stands as the week's strongest currency, outperforming trailed by Canadian Dollar and Euro. On the other end of the spectrum, Swiss Franc languishes as the week's weakest performer, with Japanese Yen not faring much better. New Zealand Dollar and British Pound are also under pressure, whereas Australian Dollar occupies a neutral position within the currency mix.
Technically, focus is back on 0.6503 support in AUD/USD with current steep decline. Firm break there will revive that case that corrective rise from 0.6442 has completed at 0.6666. Larger fall from 0.6870 should then be ready to resume through 0.6442 low.
In Asia, at the time of writing, Nikkei is up 0.22%. Hong Kong HSI is down -3.04%. China Shanghai SSE is down -1.41%. Singapore Strait Times is down -0.29%. Overnight, DOW rose 0.68%. S&P 500 rose 0.32%. NASDAQ rose 0.20%. 10-year yield fell -0.002 to 4.271.
Japan CPI core rises to 2.8% in Feb, above BoJ's target for 23rd month
Japan's CPI core (ex-fresh food) rises from 2.0% yoy to 2.8% yoy in February, matched expectations. This increase marks the first acceleration in four months and maintains the index above BoJ's 2% target for the 23rd consecutive month.
The uptick in the core CPI was primarily due to a less pronounced decline in energy prices, reflecting diminishing impact of government subsidies introduced to mitigate energy costs. Specifically, energy prices saw a decrease of -1.7% yoy, a significant moderation from -12.1% yoy drop recorded in January.
The overall headline CPI also showed an uptick, accelerating from 2.2% yoy to 2.8%yoy. However, when examining CPI core-core, which excludes both food and energy, there was a slight slowdown from 3.5% yoy to 3.2% yoy.
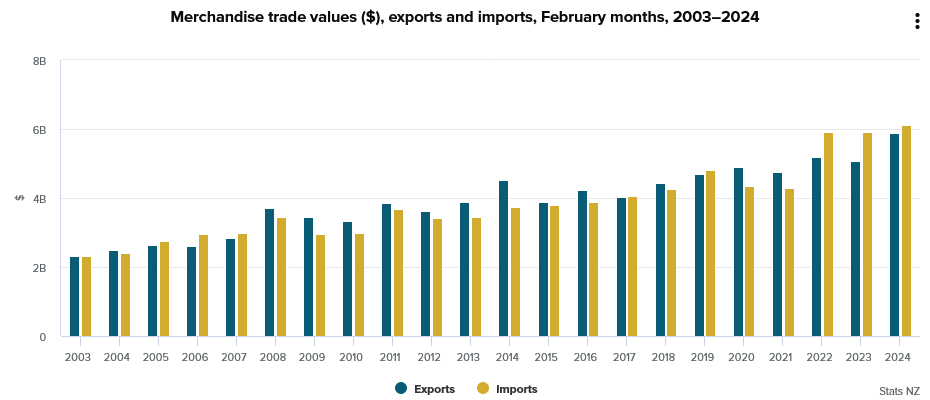
New Zealand's goods exports rises 16% yoy in Feb, imports up 3.3% yoy
In February, New Zealand's goods exports leaped by 16% yoy to NZD 5.9B. This surge contrasts with a more modest 3.3% yoy increase in goods imports, totaling NZD 6.1B. Consequently, monthly trade deficit narrowed significantly to NZD -218m, far exceeding market expectations of a shortfall of NZD -825m.
Exports to China, New Zealand's largest trading partner, increased by 10% yoy, contributing an additional NZD 154m. US saw a remarkable 52% yoy jump in exports, adding NZD 305m, while EU and Australia also recorded increases in New Zealand exports by 7.9% yoy and 5.9% yoy, respectively. However, trade with Japan contracted, with exports declining by -10% yoy.
On the import front, China and South Korea marked significant increases of 7.1% yoy and 42% yoy, respectively, indicating robust demand for goods from these economies. Conversely, imports from US and EU saw downturns, declining by 20% yoy and 7% yoy.
Looking ahead
Uk retail sales and German Ifo busienss climate are the main focuses in European session. Later in the day, Canada will release retail sales.
GBP/USD Daily Outlook
Daily Pivots: (S1) 1.2605; (P) 1.2704; (R1) 1.2757; More...
GBP/USD's steep decline and break of 1.2666 support indicates resumption of fall from 1.2892. Intraday bias is back on the downside for 1.2517 structural support next. Decisive break there will indicate larger bearish reversal. For now, risk will remain on the downside as long as 1.2802 resistance holds, in case of recovery.
In the bigger picture, price actions from 1.3141 medium term top are seen as a corrective pattern to up trend from 1.0351 (2022 low). Rise from 1.2036 is seen as the second leg, which is still in progress. But upside should be limited by 1.3141 to bring the third leg of the pattern. Meanwhile, break of 1.2517 support will argue that the third leg has already started for 38.2% retracement of 1.0351 (2022 low) to 1.3141 at 1.2075 again.
Economic Indicators Update
| GMT | Ccy | Events | Actual | Forecast | Previous | Revised |
|---|---|---|---|---|---|---|
| 21:45 | NZD | Trade Balance (MZD) Feb | -218M | -825M | -976M | -1089M |
| 23:30 | JPY | National CPI Y/Y Feb | 2.80% | 2.20% | ||
| 23:30 | JPY | National CPI ex Fresh Food Y/Y Feb | 2.80% | 2.80% | 2.00% | |
| 23:30 | JPY | National CPI ex Food Energy Y/Y Feb | 3.20% | 3.50% | ||
| 00:01 | GBP | GfK Consumer Confidence Mar | -21 | -20 | -21 | |
| 07:00 | GBP | Retail Sales M/M Feb | -0.30% | 3.40% | ||
| 09:00 | EUR | Germany IFO Business Climate Mar | 86.2 | 85.5 | ||
| 09:00 | EUR | Germany IFO Current Assessment Mar | 86.8 | 86.9 | ||
| 09:00 | EUR | Germany IFO Expectations Mar | 84.7 | 84.1 | ||
| 12:30 | CAD | Retail Sales M/M Jan | -0.40% | 0.90% | ||
| 12:30 | CAD | Retail Sales ex Autos M/M Jan | -0.50% | 0.60% |
Technical Outlook and Review
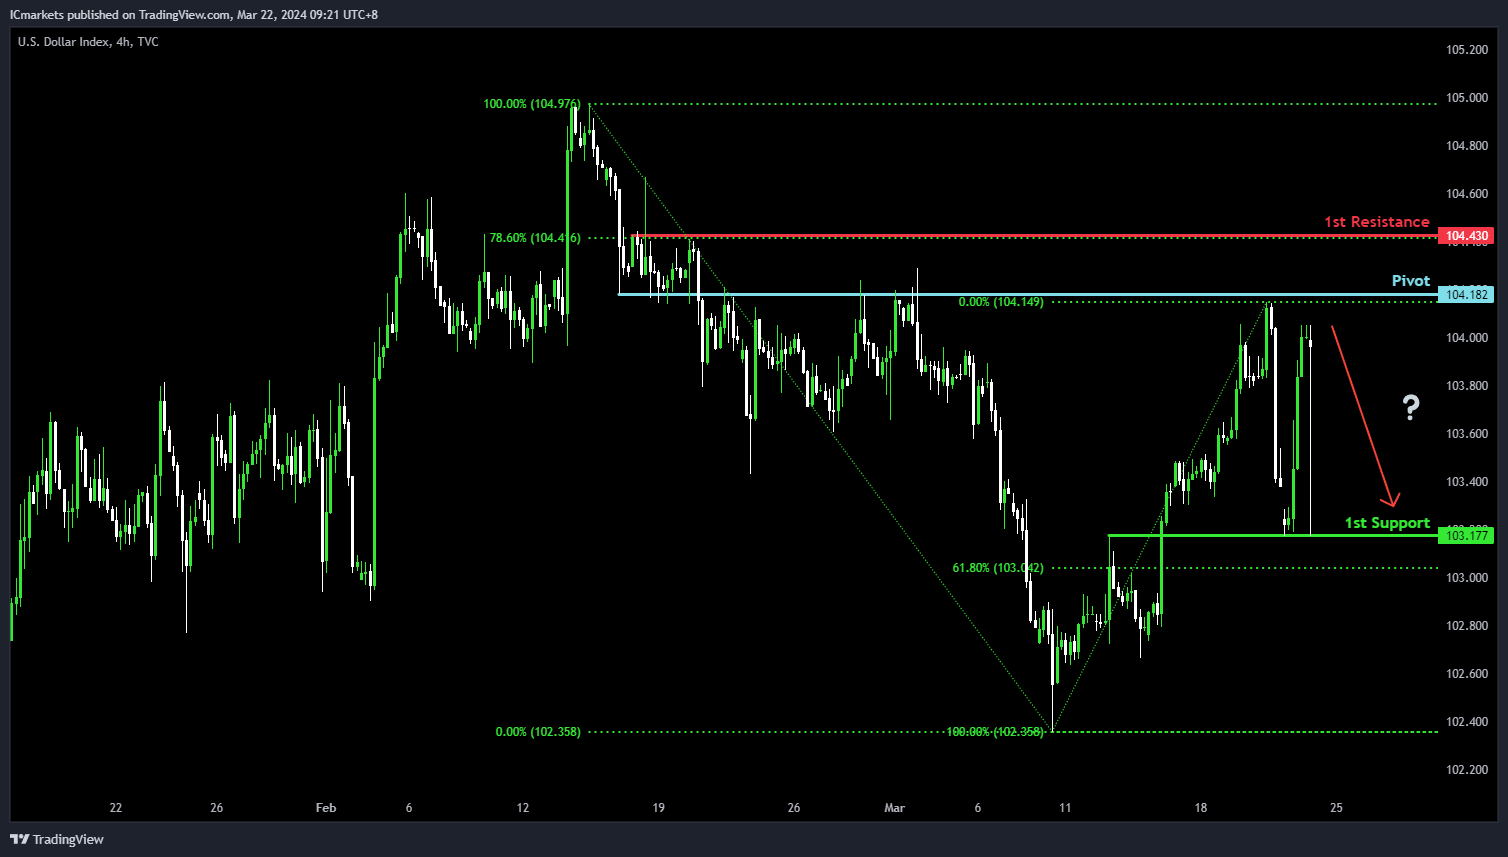
DXY:
The dollar index (DXY) chart currently demonstrates an overall bullish momentum. In this context, there is a potential scenario for price to rise towards the pivot before potentially making a bearish reaction and pull back towards the 1st support.
The pivot level at 104.18 is identified as an overlap resistance where price could potentially pull back from to drop lower. The 1st support level at 103.17 is marked as an overlap support that aligns close to the 61.80% Fibonacci Retracement level, reinforcing its significance as a key support level.
On the resistance side, the 1st resistance level at 104.43 is noted as a pullback resistance that aligns with the 78.60% Fibonacci Retracement level, potentially limiting any further upward movement.
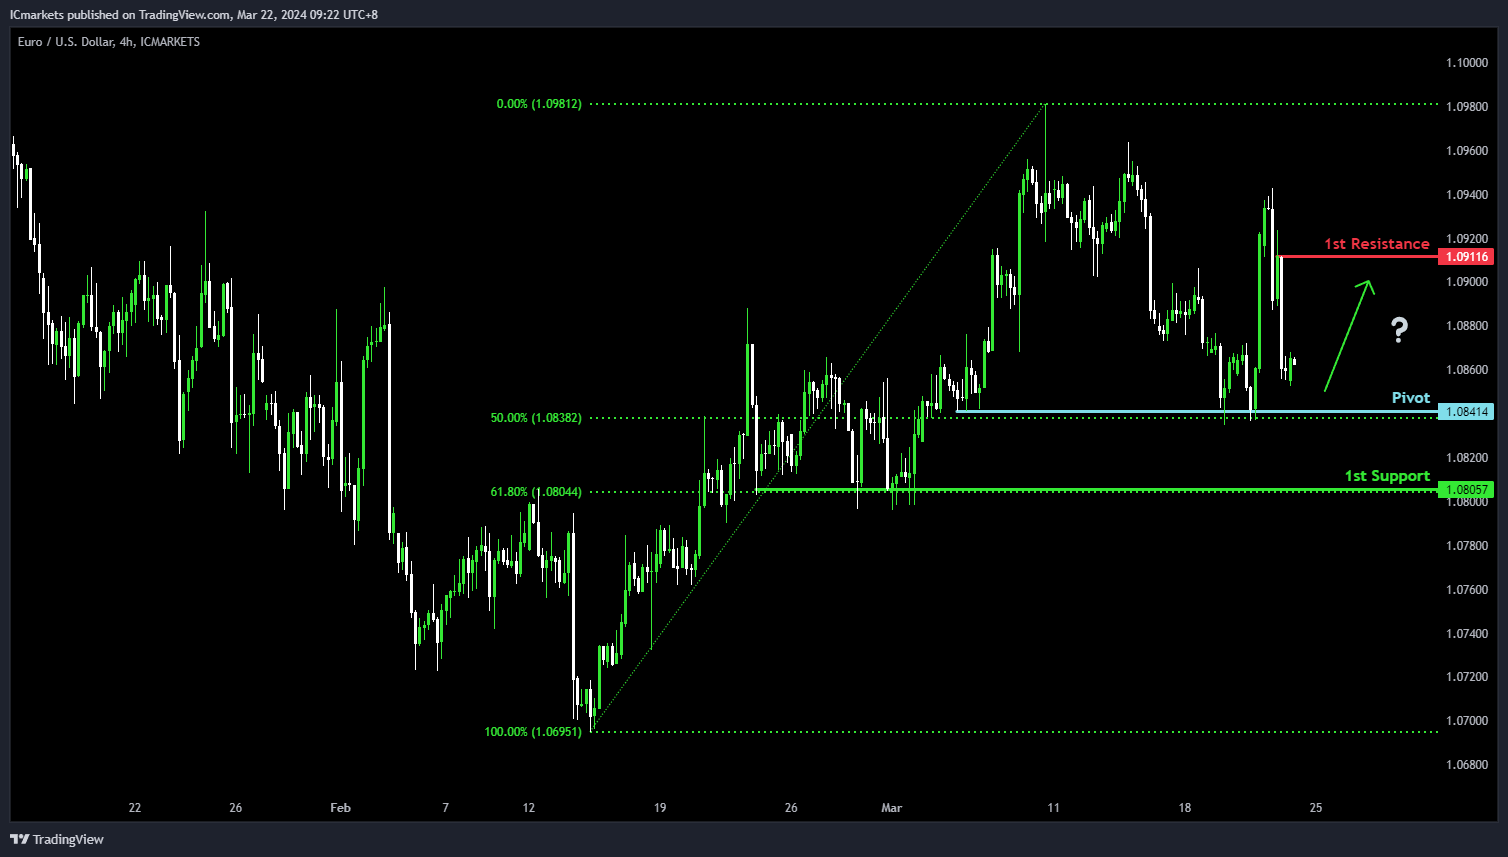
EUR/USD:
The EUR/USD chart currently demonstrates an overall bearish momentum. In this context, there is a potential scenario for price to continue falling towards the pivot before potentially making a weak bullish reaction.
The pivot level at 1.0841 is identified as a pullback support that aligns with the 50.00% Fibonacci Retracement level where price could potentially bounce from to move higher. The 1st resistance level at 1.0911 is noted as a pullback resistance, potentially limiting any further upward movement.
On the support side, the 1st support level at 1.0805 is marked as a pullback support that aligns with the 61.80% Fibonacci Retracement level, reinforcing its significance as a key support level.
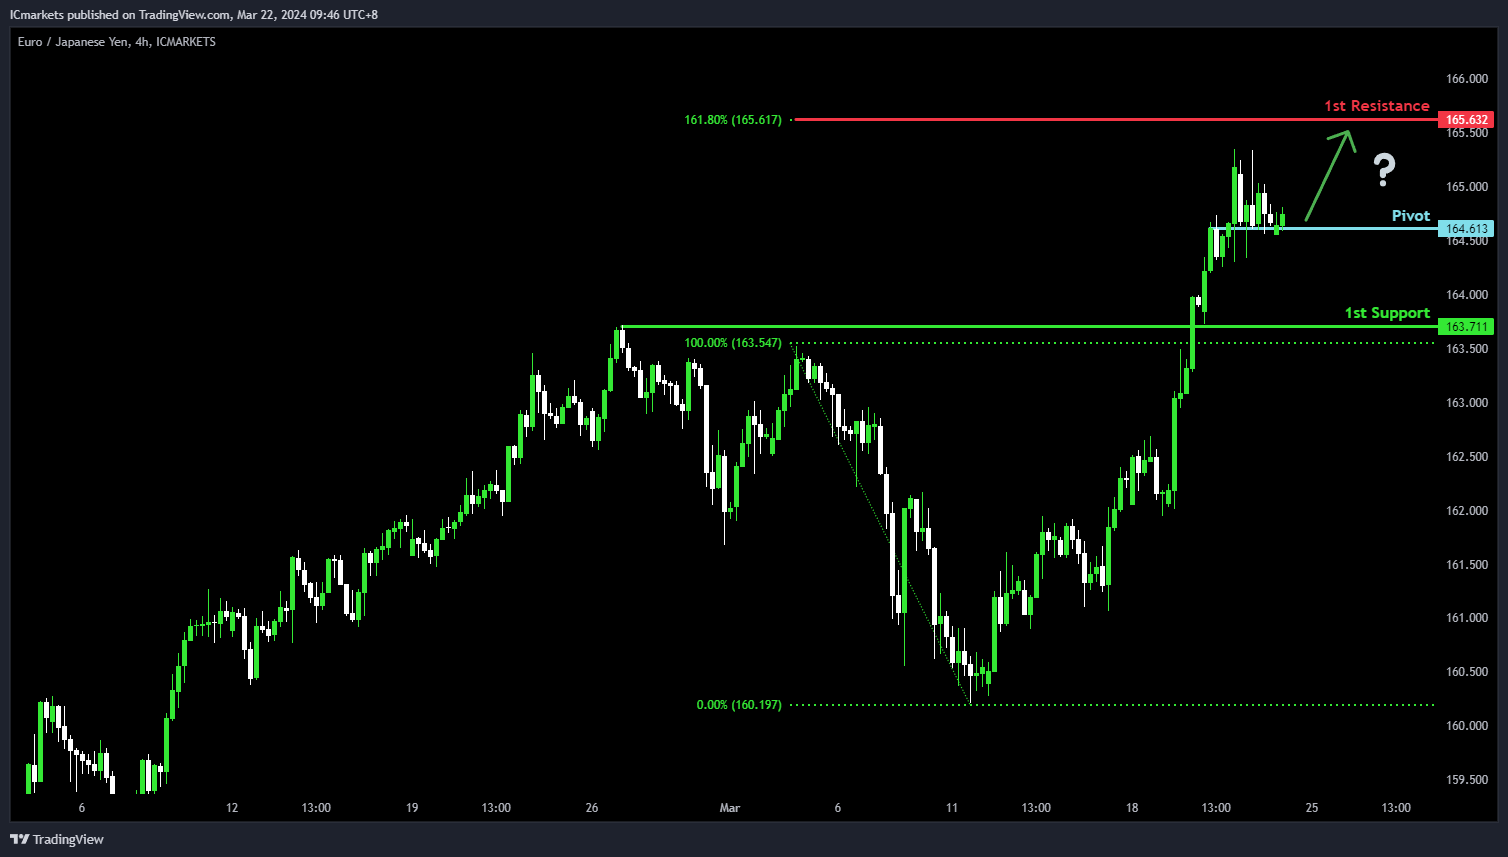
EUR/JPY:
The EUR/JPY chart currently demonstrates an overall bullish momentum. In this context, there is a potential scenario for price to potentially bounce off the pivot to rise towards the 1st resistance.
The pivot level at 164.61 is identified as an overlap support where price could potentially bounce from to rise higher. The 1st resistance level at 165.63 is noted as a resistance level that aligns with the 161.80% Fibonacci Extension level, potentially limiting any further upward movement.
On the support side, the 1st support level at 163.71 is marked as an overlap support, reinforcing its significance as a key support level.
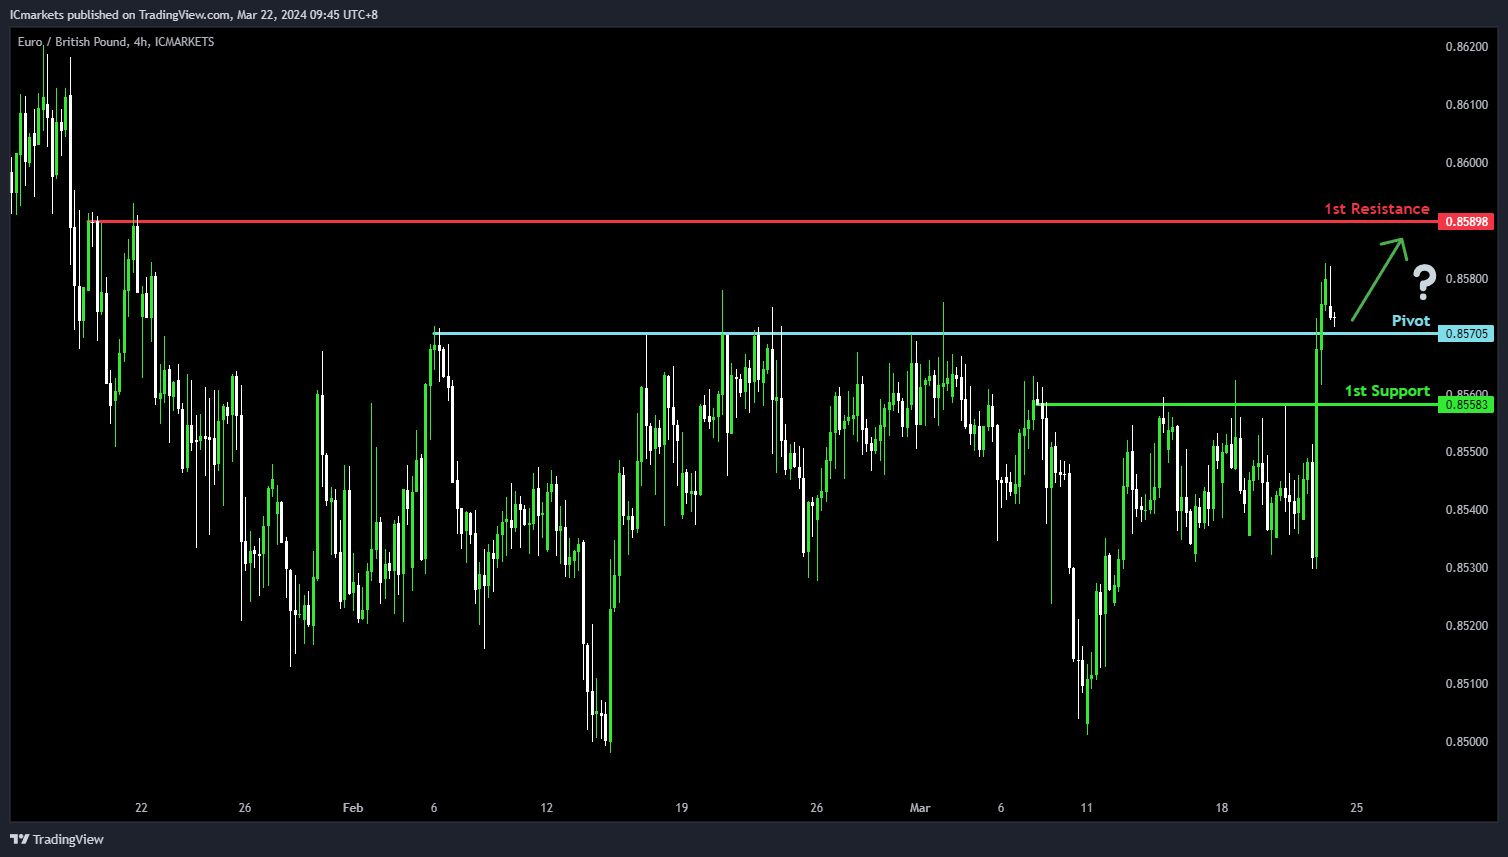
EUR/GBP:
The EUR/GBP chart currently demonstrates an overall bullish momentum. In this context, there is a potential scenario for price to potentially bounce off the pivot to rise towards the 1st resistance.
The pivot level at 0.8570 is identified as a pullback where price could potentially bounce from to rise higher. The 1st resistance level at 0.8589 is noted as a pullback resistance, potentially limiting any further upward movement.
On the support side, the 1st support level at 0.8558 is marked as a pullback support, reinforcing its significance as a key support level.
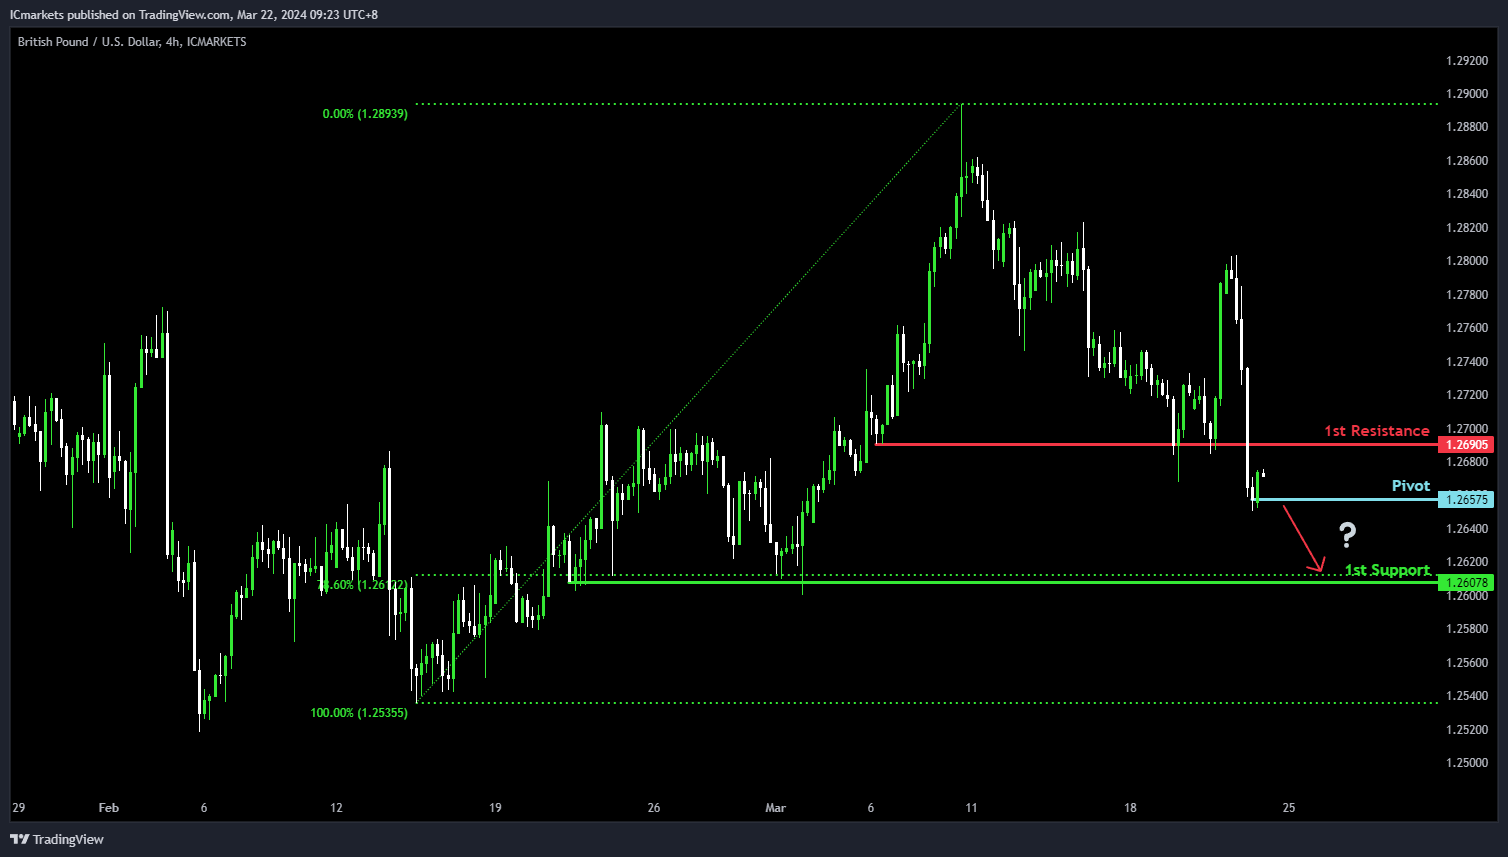
GBP/USD:
The GBP/USD chart currently demonstrates an overall bearish momentum. In this context, there is a potential scenario for price to break under the pivot and fall towards the 1st support.
The pivot level at 1.2657 is identified as a pullback support where price could potentially break under to continue the bearish momentum. The 1st support level at 1.2607 is marked as a pullback support that aligns with the 78.60% Fibonacci Retracement level, reinforcing its significance as a key support level.
On the resistance side, the 1st resistance level at 1.2690 is noted as a pullback resistance, potentially limiting any further upward movement.
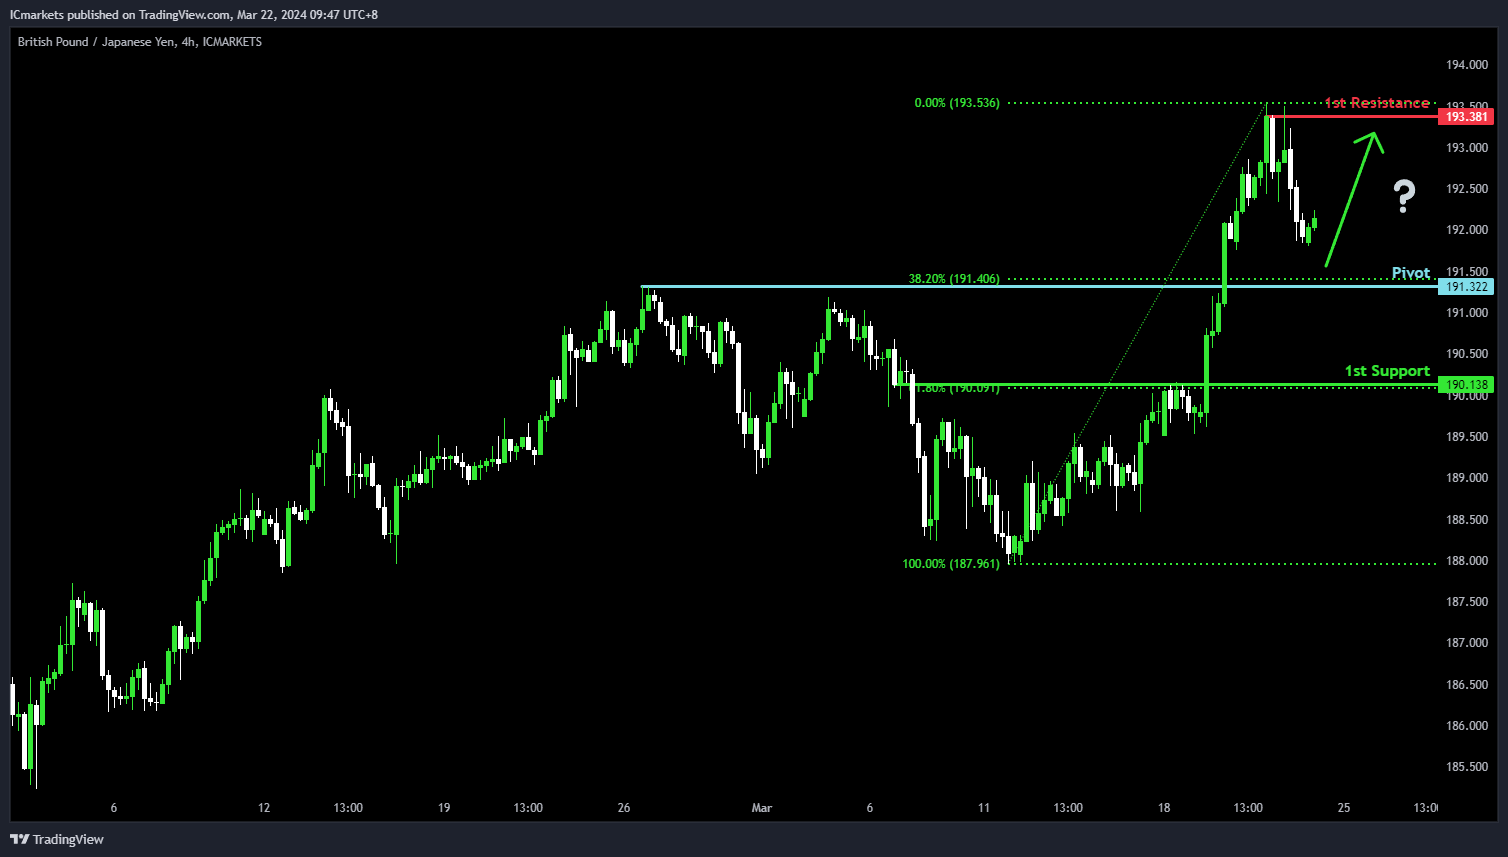
GBP/JPY:
The GBP/JPY chart currently demonstrates an overall bullish momentum. In this context, there is a potential scenario for price to potentially bounce off the pivot to rise towards the 1st resistance.
The pivot level at 191.32 is identified as a pullback support that aligns with the 38.20% Fibonacci Retracement level where price could potentially bounce from to rise higher. The 1st resistance level at 193.38 is noted as a pullback resistance, potentially limiting any further upward movement.
On the support side, the 1st support level at 190.13 is marked as an overlap support that aligns with the 61.80% Fibonacci Retracement level, reinforcing its significance as a key support level.
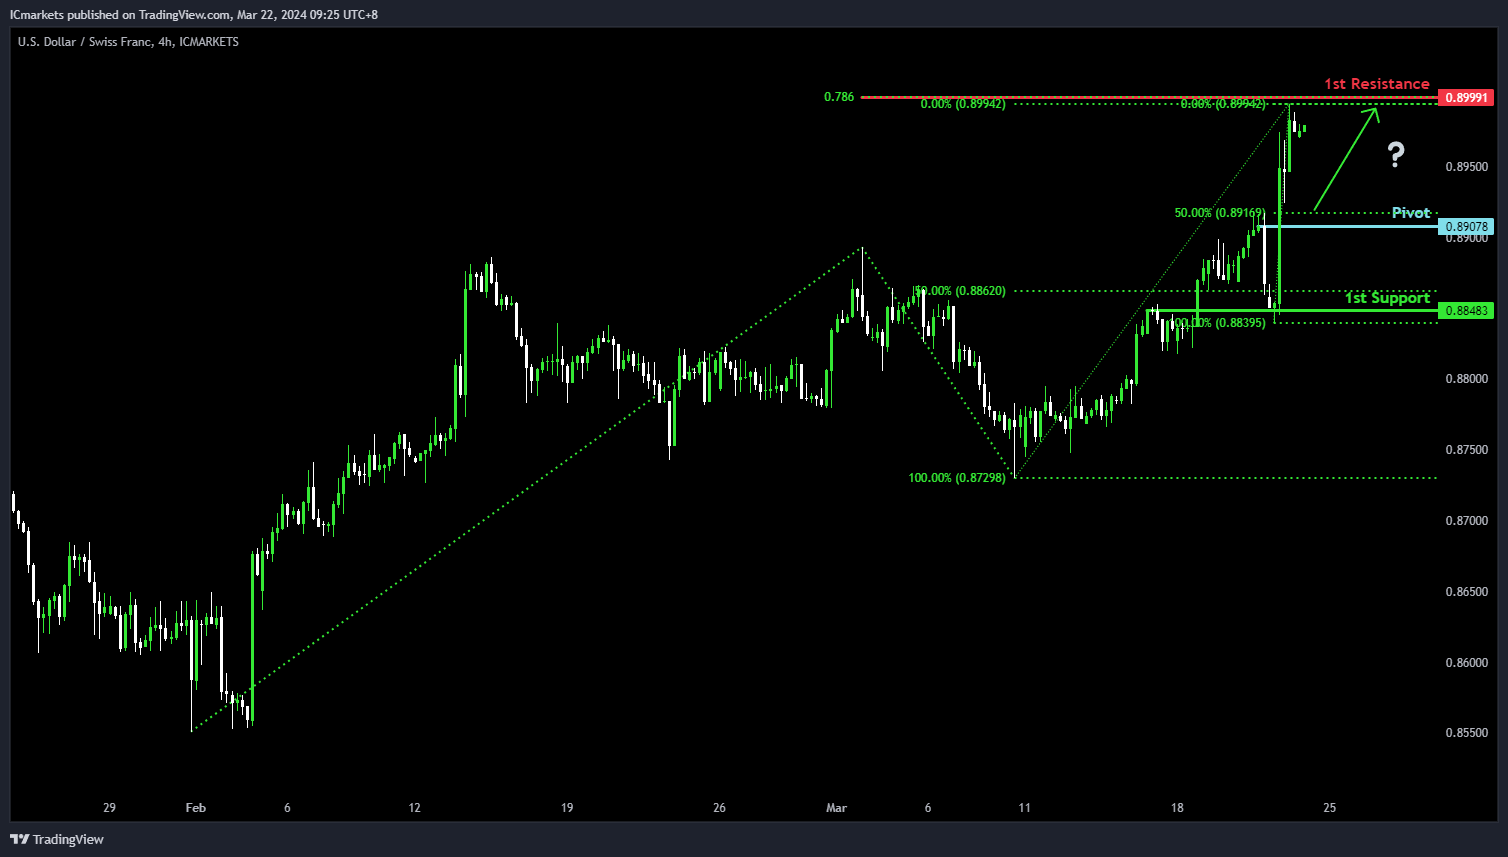
USD/CHF:
The USD/CHF chart currently demonstrates an overall bullish momentum. In this context, there is a potential scenario for price to potentially bounce off the pivot to rise towards the 1st resistance.
The pivot level at 0.8907 is identified as a pullback support that aligns close to the 50.00% Fibonacci Retracement level where price could potentially bounce from to rise higher. The 1st resistance level at 0.8999 is noted as a resistance level that aligns with the 78.60% Fibonacci Projection level, potentially limiting any further upward movement.
On the support side, the 1st support level at 0.8848 is marked as an overlap support that aligns close to the 50.00% Fibonacci Retracement level, reinforcing its significance as a key support level.
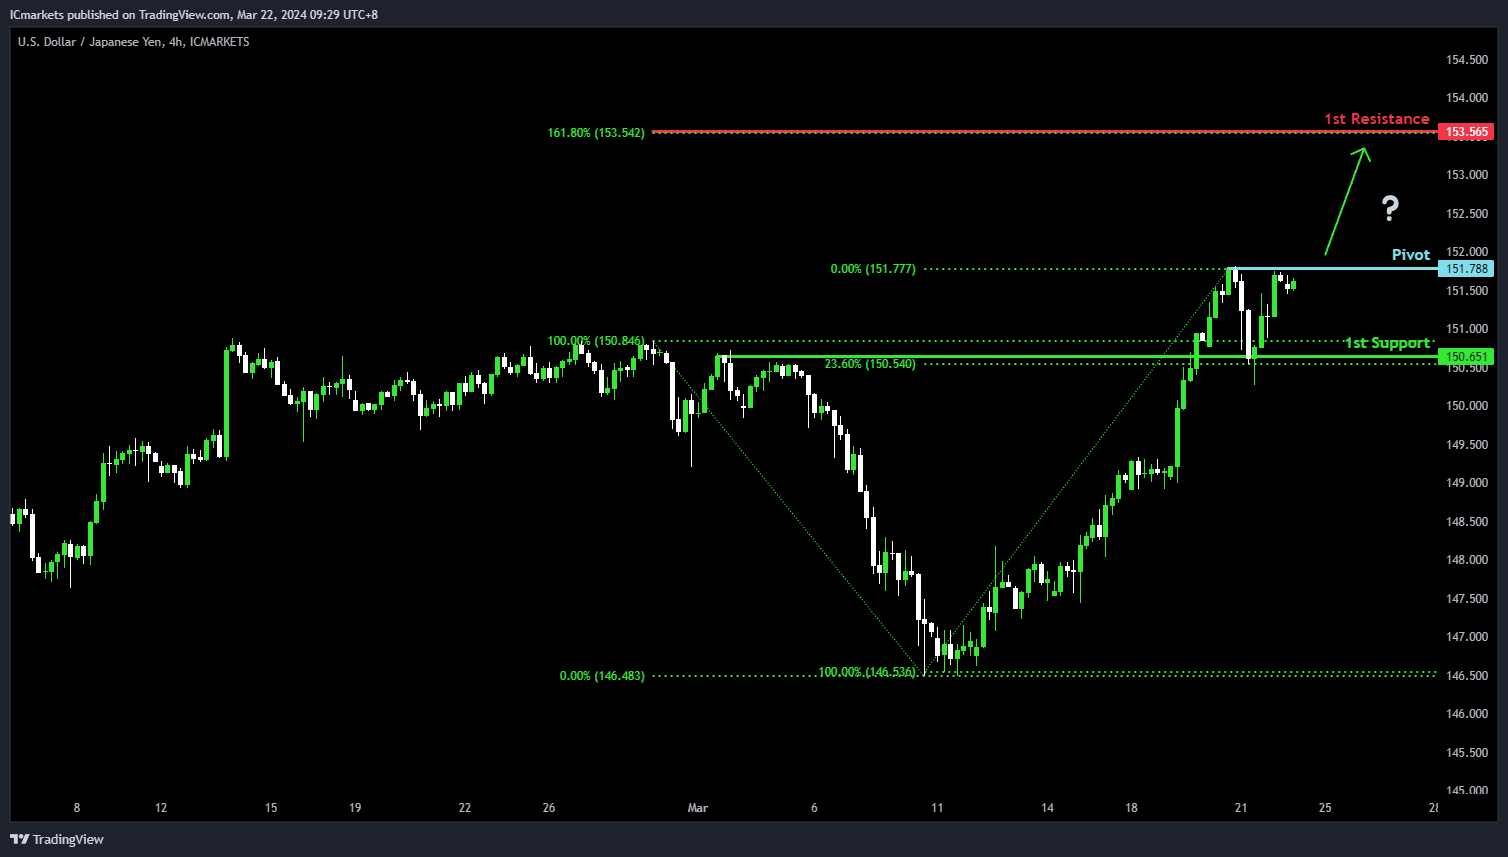
USD/JPY:
The USD/JPY chart currently demonstrates an overall bullish momentum. In this context, there is a potential scenario for price to potentially break above the pivot to rise towards the 1st resistance.
The pivot level at 151.78 is identified as a pullback resistance where price could potentially break above to rise higher. The 1st resistance level at 153.56 is noted as a resistance level that aligns with the 161.80% Fibonacci Extension level, potentially limiting any further upward movement.
On the support side, the 1st support level at 150.65 is marked as an overlap support that aligns close to the 23.60% Fibonacci Retracement level, reinforcing its significance as a key support level.
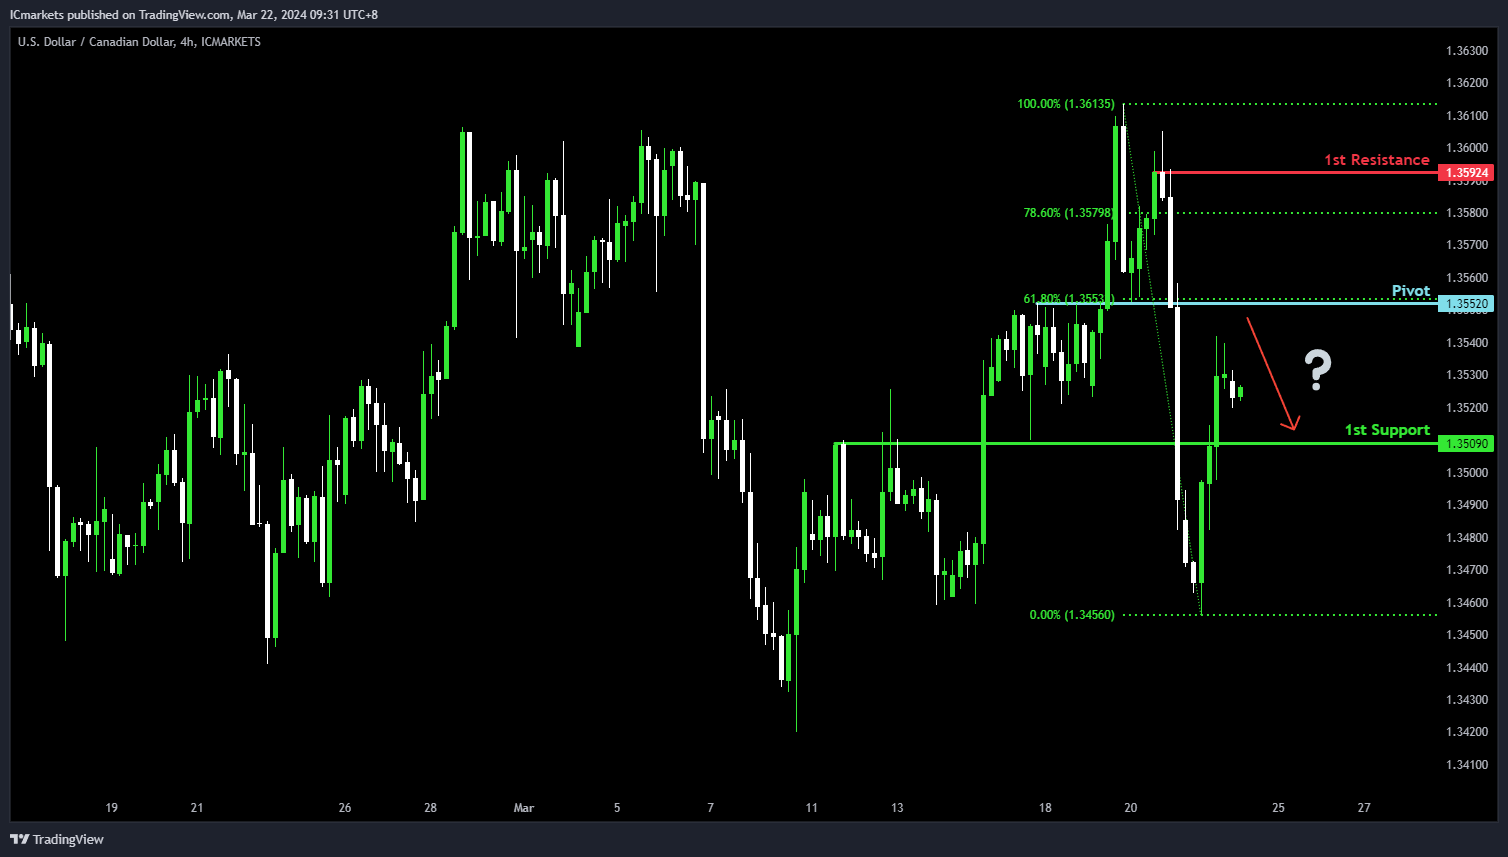
USD/CAD:
The USD/CAD chart currently demonstrates an overall bullish momentum. In this context, there is a potential scenario for price to rise towards the pivot and make a weak bearish reaction from here.
The pivot level at 1.3552 is identified as a pullback resistance that aligns with the 61.80% Fibonacci Retracement level where price could potentially make a weak bearish reaction. The 1st resistance level at 1.3592 is noted as a pullback resistance that sits above the 78.60% Fibonacci Retracement level, potentially limiting any further upward movement.
On the support side, the 1st support level at 1.3509 is marked as an overlap support, reinforcing its significance as a key support level.
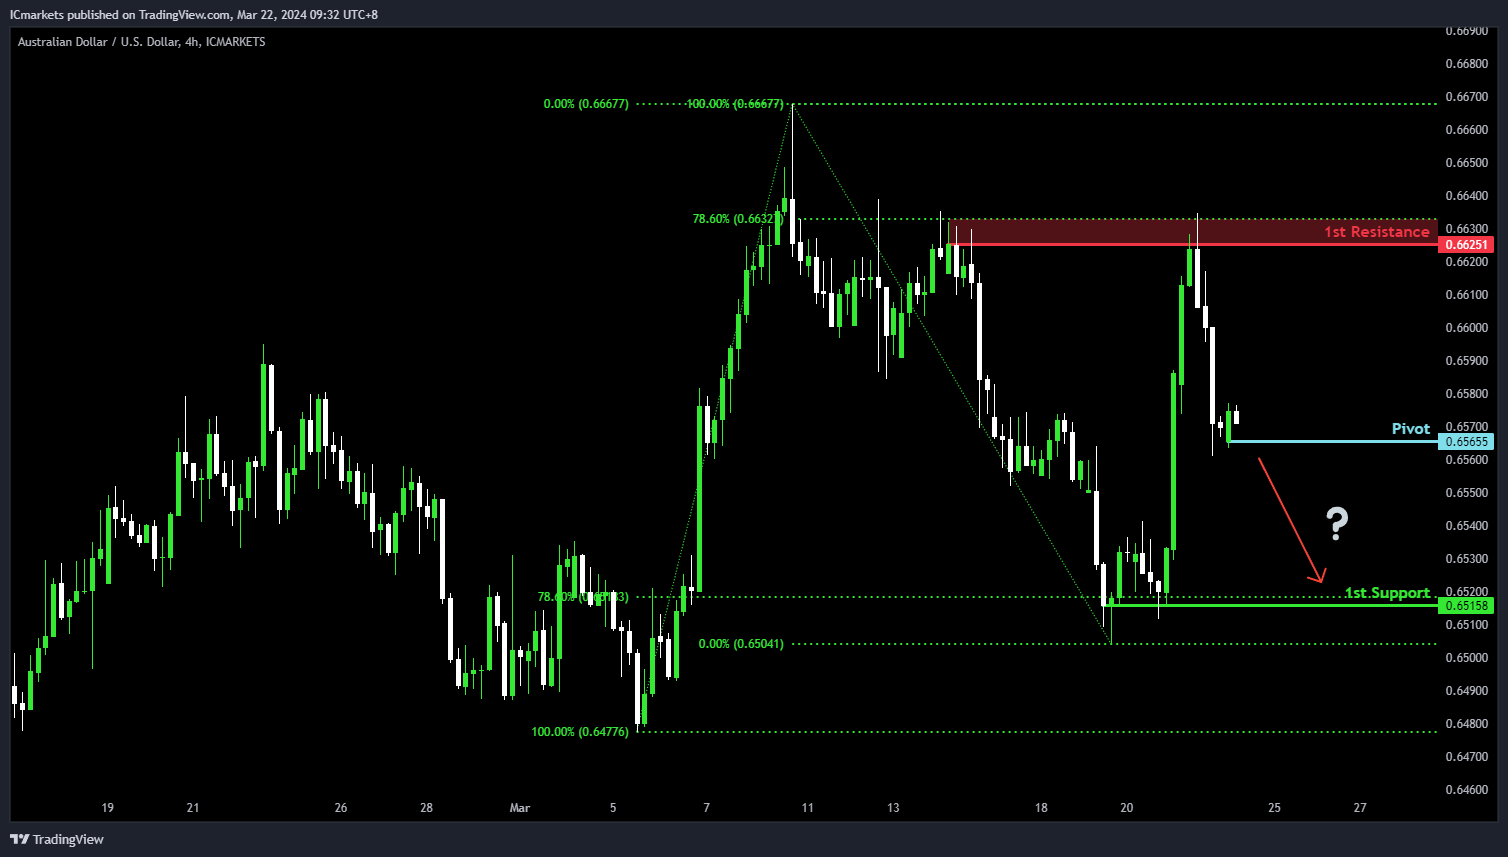
AUD/USD:
The AUD/USD chart currently demonstrates an overall bearish momentum. In this context, there is a potential scenario for price to break under the pivot and fall towards the 1st support.
The pivot level at 0.6565 is identified as a pullback support where price could potentially break under to drop lower. The 1st support level at 0.6515 is marked as a pullback support that aligns with the 78.60% Fibonacci Retracement level, reinforcing its significance as a key support level.
On the resistance side, the 1st resistance level at 0.6625 is noted as a pullback resistance that aligns close to the 78.60% Fibonacci Retracement level, potentially limiting any further upward movement.
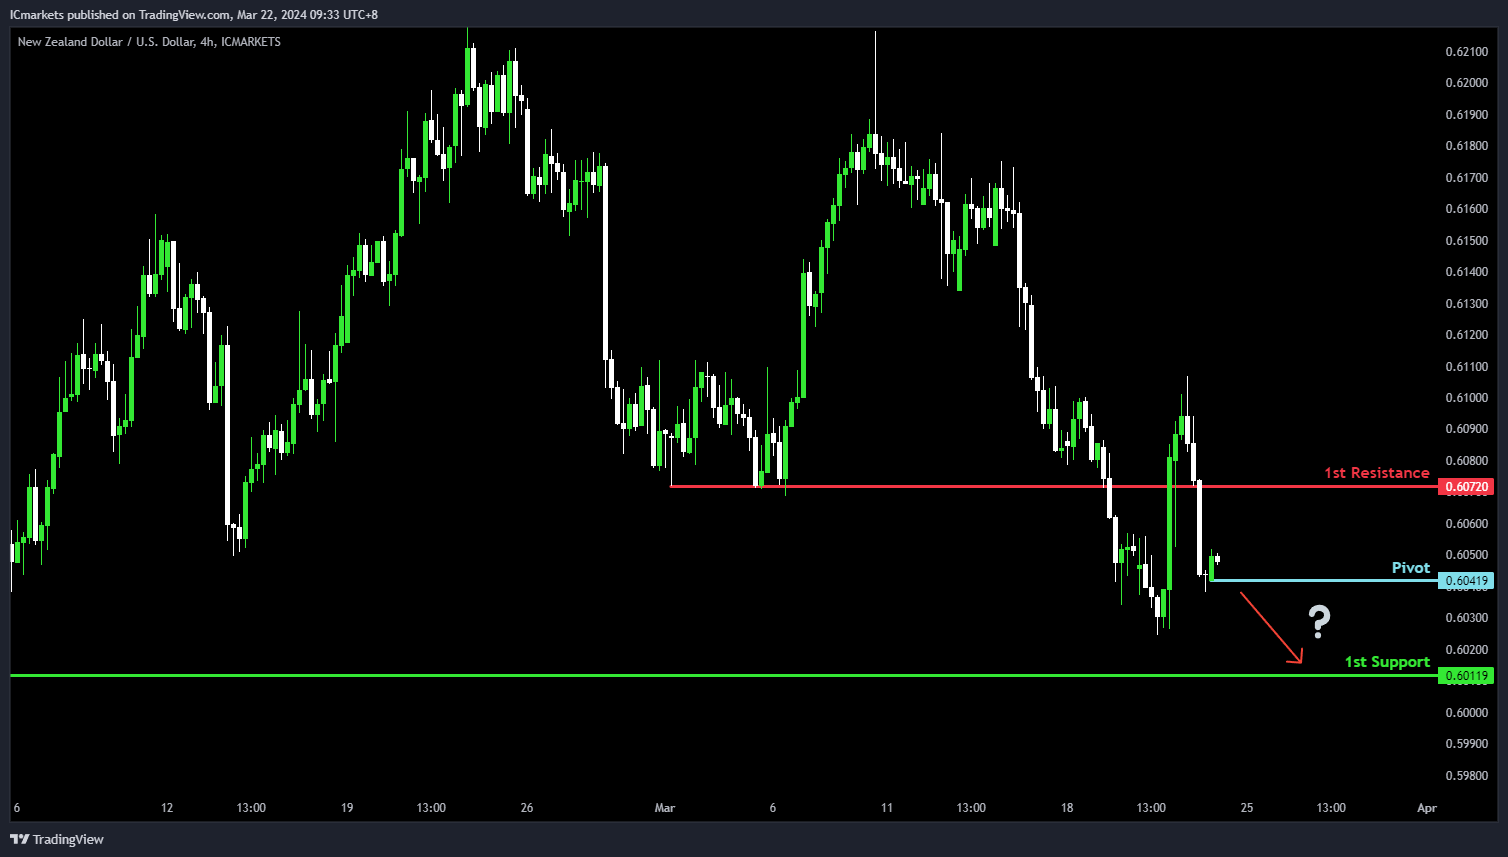
NZD/USD
The NZD/USD chart currently demonstrates an overall bearish momentum. In this context, there is a potential scenario for price to break under the pivot and fall towards the 1st support.
The pivot level at 0.6041 is identified as a pullback support where price could potentially break under to drop lower. The 1st support level at 0.6011 is also marked as a pullback support, reinforcing its significance as a key support level.
On the resistance side, the 1st resistance level at 0.6072 is noted as a pullback resistance, potentially limiting any further upward movement.
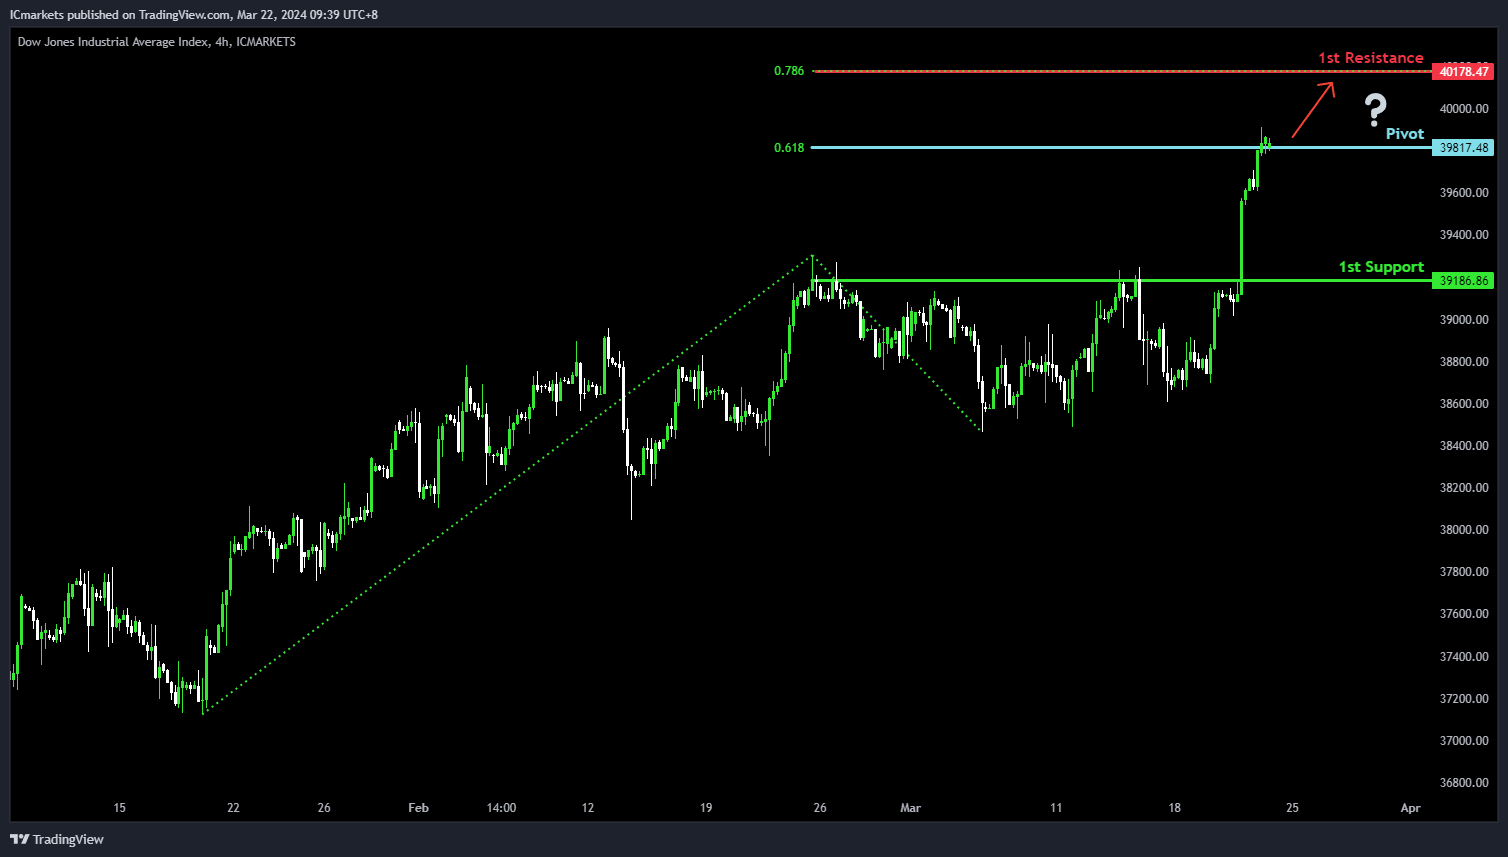
DJ30:
The Dow Jones chart (DJ30) currently demonstrates an overall bullish momentum. In this context, there is a potential scenario for price to break above the pivot and rise towards the 1st resistance.
The pivot level at 39,817.48 is identified as a level where price could potentially break above to rise higher. The 1st resistance level at 40,178.47 is noted as a resistance level that aligns with the 78.60% Fibonacci Projection level, potentially impeding any further bullish movement.
On the support side, the 1st support level at 39,186.86 is marked as a pullback support, reinforcing its significance as a key support level.
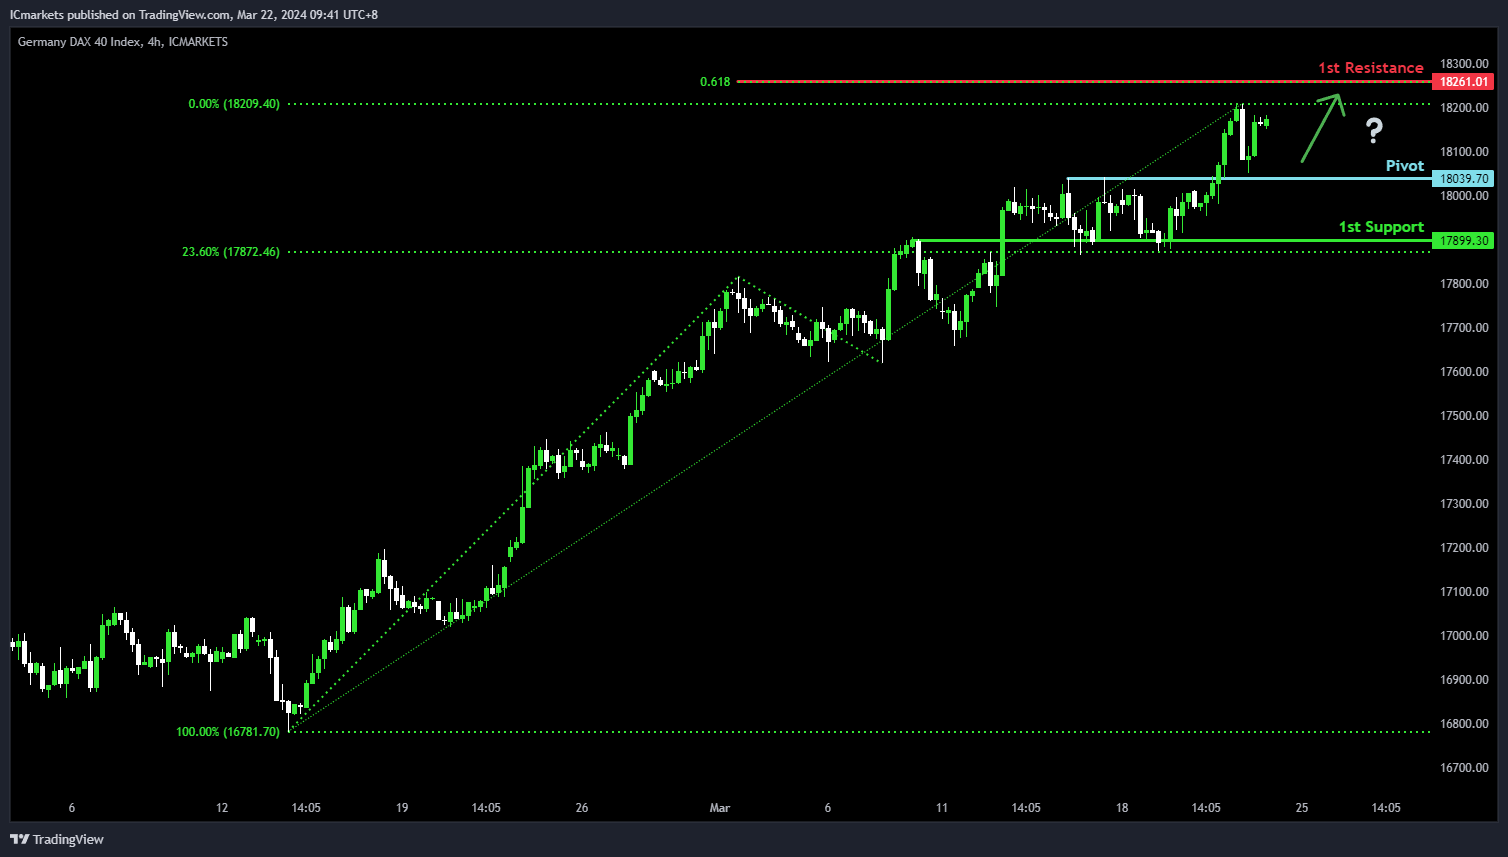
GER40:
The DAX chart (GER40) currently demonstrates an overall bullish momentum. In this context, there is a potential scenario for price to fall towards the pivot before making a bullish bounce towards the 1st resistance.
The pivot level at 18,039.70 is identified as an overlap support where price could potentially reverse from to bounce higher. The 1st resistance level at 18,261.01 is noted as a resistance level that aligns with the 61.80% Fibonacci Projection level, potentially impeding any further bullish movement.
On the support side, the 1st support level at 17,899.30 is marked as an overlap support, reinforcing its significance as a key support level.
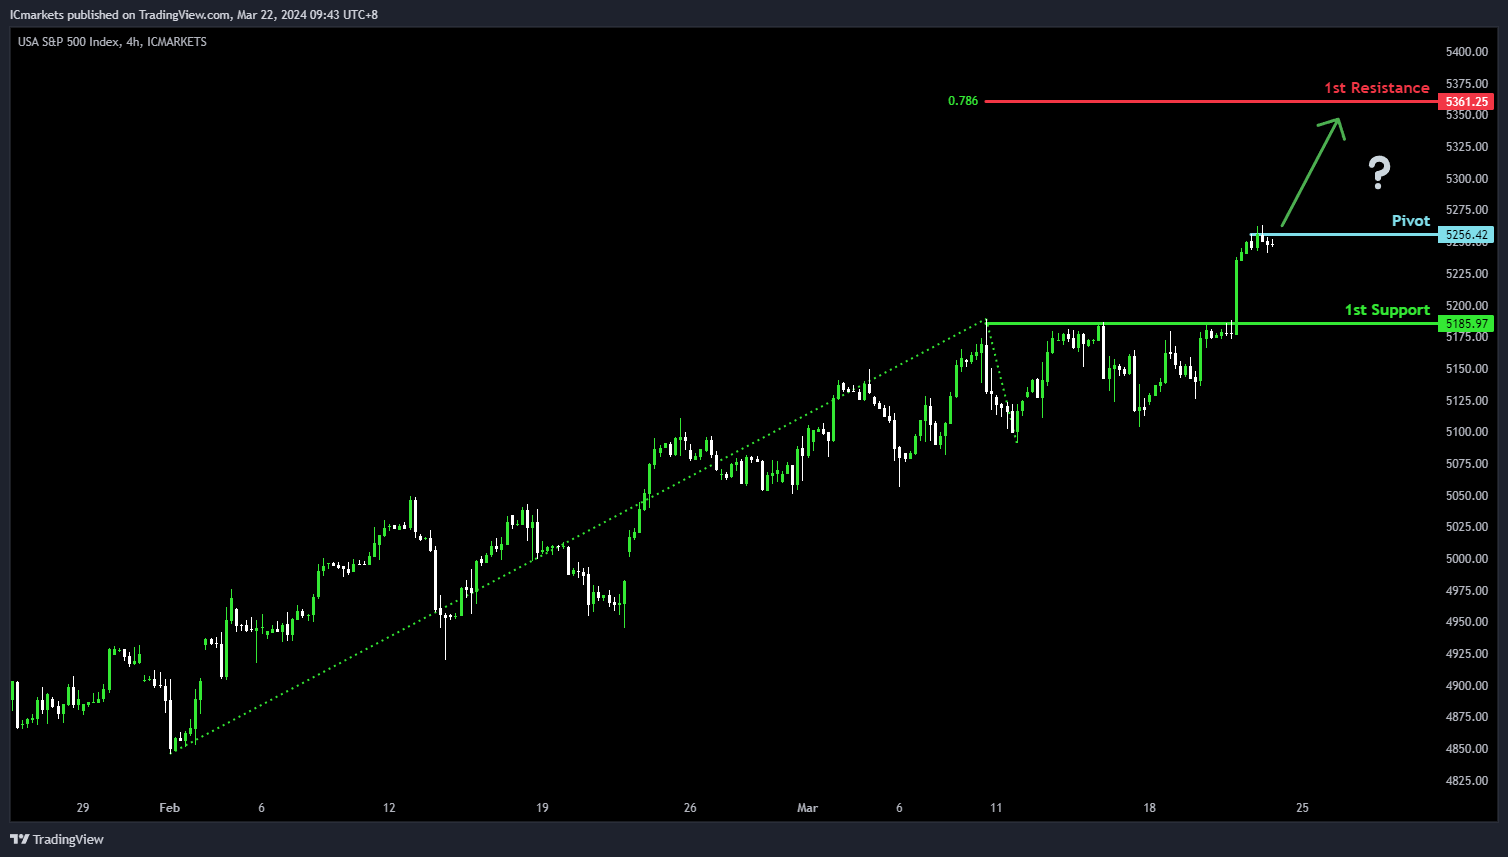
US500:
The S&P 500 chart (US500) currently demonstrates an overall bullish momentum. In this context, there is a potential scenario for price to break above the pivot and rise towards the 1st resistance.
The pivot level at 5,256.42 is identified as a level where price could potentially break above to rise higher. The 1st resistance level at 5,361.25 is noted as a resistance level that aligns with the 78.60% Fibonacci Projection level, potentially impeding any further bullish movement.
On the support side, the 1st support level at 5,185.97 is marked as a pullback support, reinforcing its significance as a key support level.
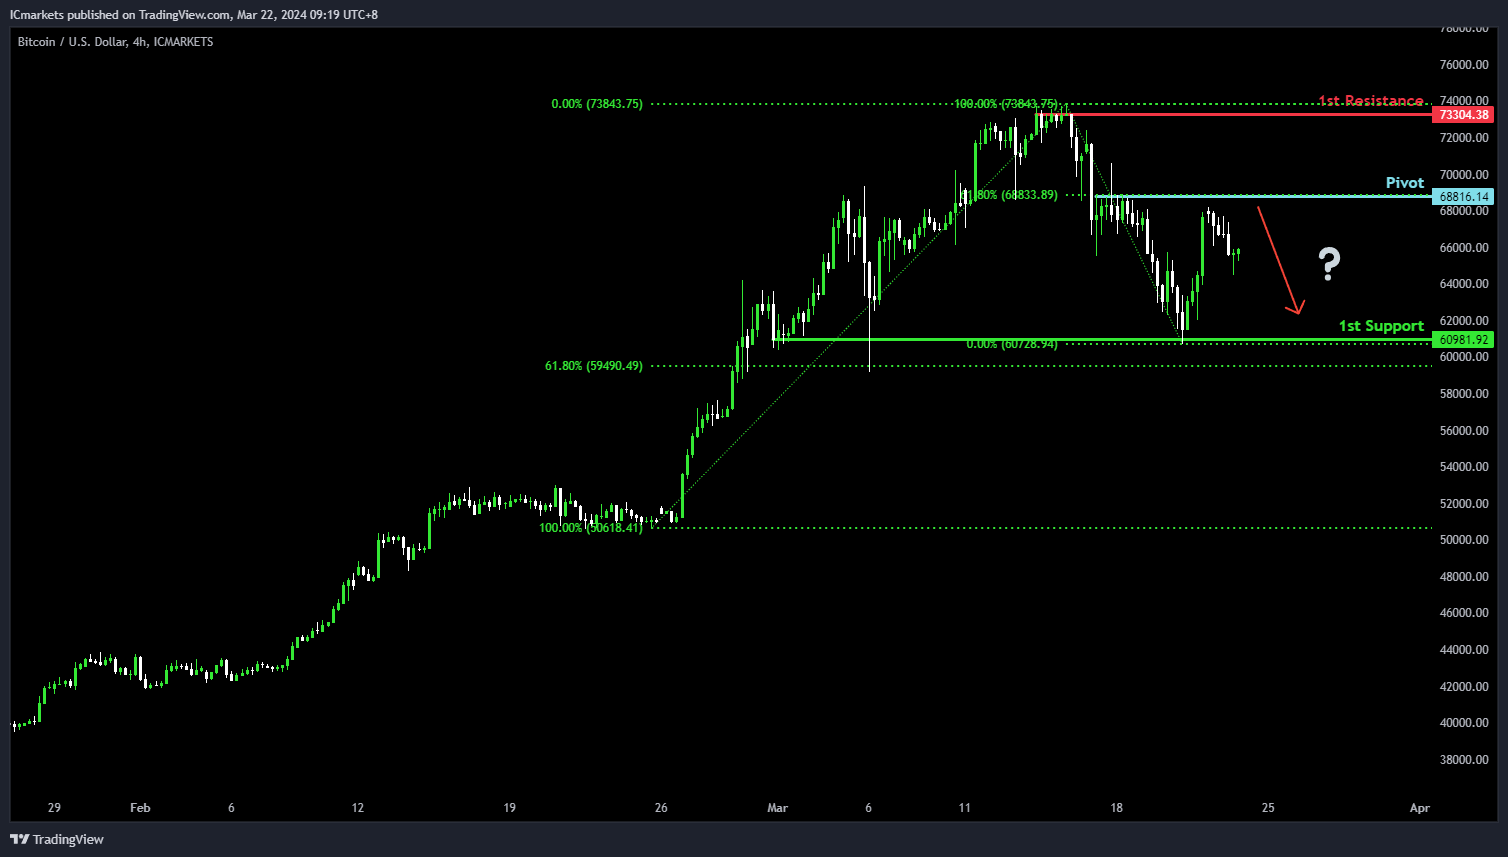
BTC/USD:
The Bitcoin chart (BTC/USD) currently demonstrates an overall bearish momentum. However, there is a potential scenario for price to rise towards the pivot and reverse to drop lower towards the 1st support.
The pivot level at 68,816.14 is identified as a pullback support that aligns with the 61.80% Fibonacci Retracement level where price could potentially make a bearish reversal and drop lower. The 1st support level at 60,981.92 is marked as a pullback support that aligns close to the 61.80% Fibonacci Retracement level, reinforcing its significance as a key support level.
To the upside, the 1st resistance level at 73,304.38 is noted as a swing-high resistance at the all-time high, further reinforcing its significance as a potential barrier to further bullish movement.
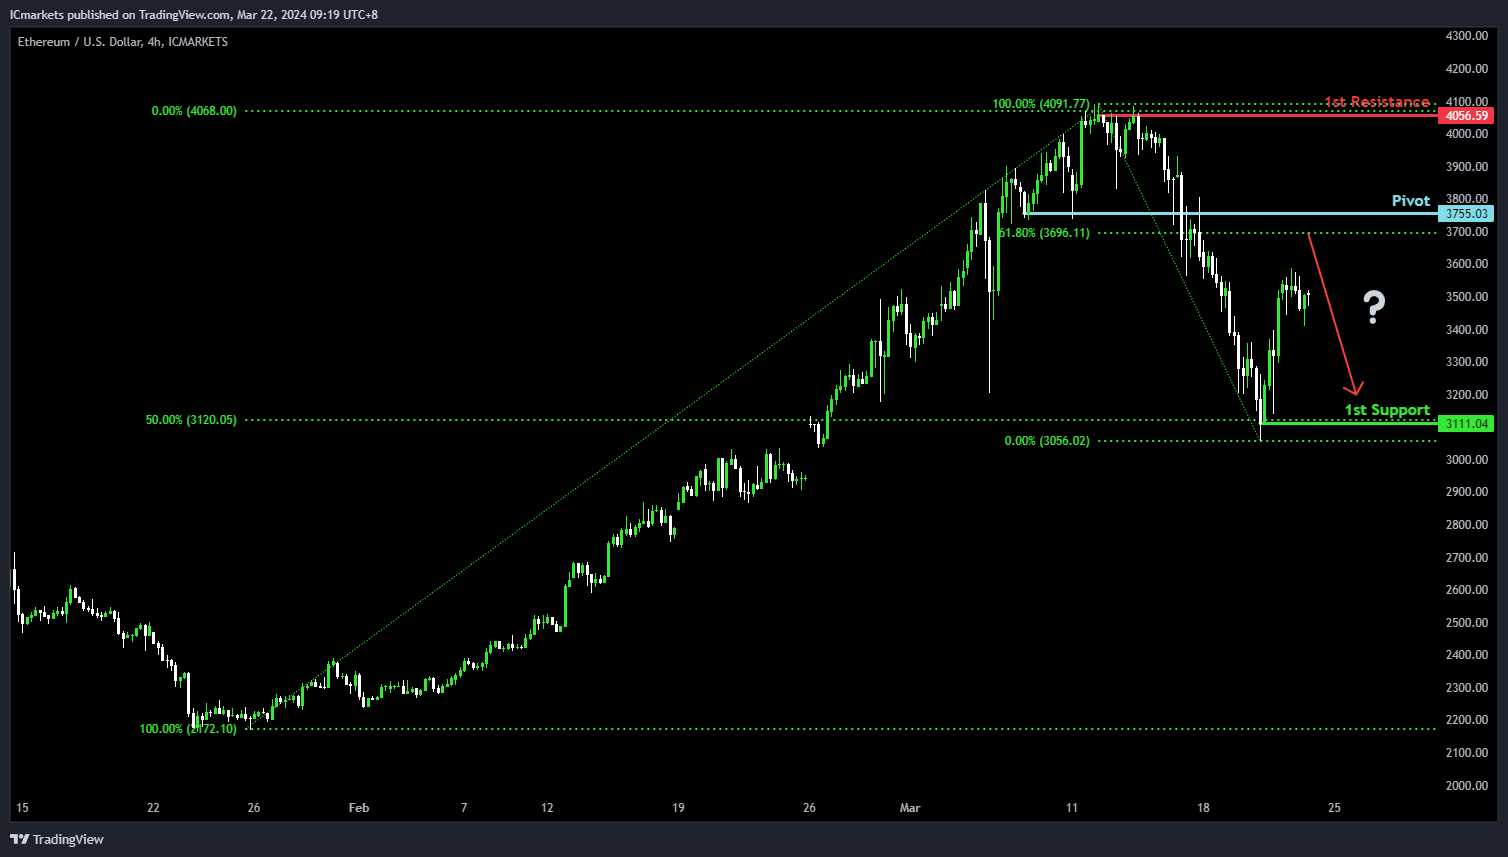
ETH/USD:
The Ethereum chart (ETH/USD) currently demonstrates an overall bearish momentum. However, there is a potential scenario for price to rise towards the pivot and reverse to drop lower towards the 1st support.
The pivot level at 3,755.03 is identified as a pullback support that aligns close to the 61.80% Fibonacci Retracement level where price could potentially make a bearish reversal and drop lower. The 1st support level at 3,111.04 is marked as a pullback support that aligns with the 50.00% Fibonacci Retracement level, reinforcing its significance as a key support level.
To the upside, the 1st resistance level at 4,056.59 is noted as a swing-high resistance, further reinforcing its significance as a potential barrier to further bullish movement.
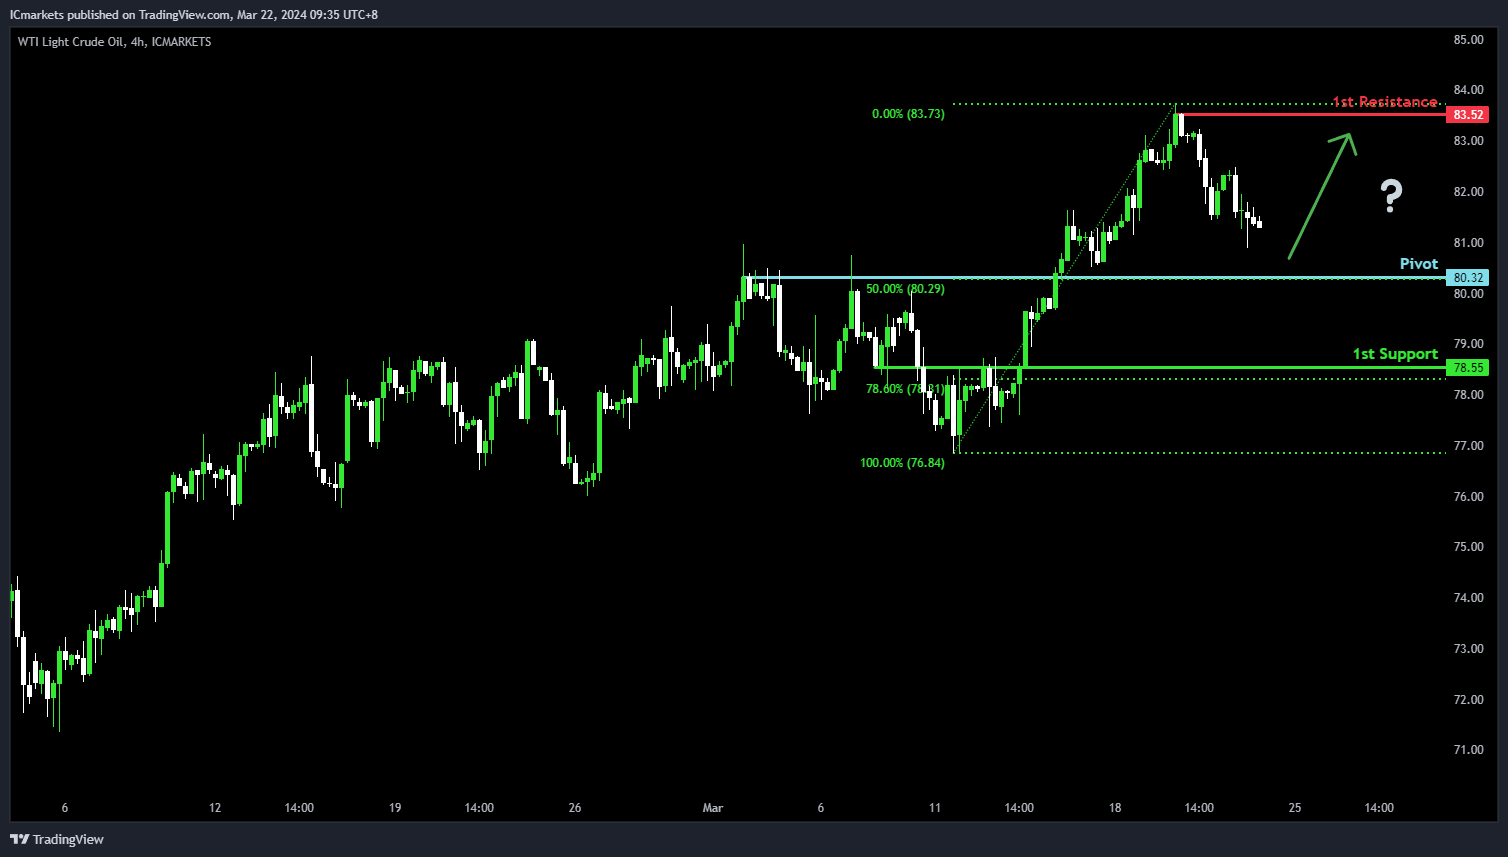
WTI/USD:
The WTI (West Texas Intermediate) oil chart currently demonstrates an overall bullish momentum. However, there is a potential scenario for price to fall towards the pivot before making a bullish bounce to rise towards the 1st resistance.
The pivot level at 80.32 is identified as an overlap support that aligns with the 50.00% Fibonacci Retracement level where price could potentially make a bullish bounce to climb higher. The 1st resistance level at 83.52 is noted as a pullback resistance, further reinforcing its significance as a potential barrier to further bullish movement.
To the downside, the 1st support level at 78.55 is marked as an overlap support that aligns close to the 78.60% Fibonacci Retracement level, reinforcing its significance as a key support level.
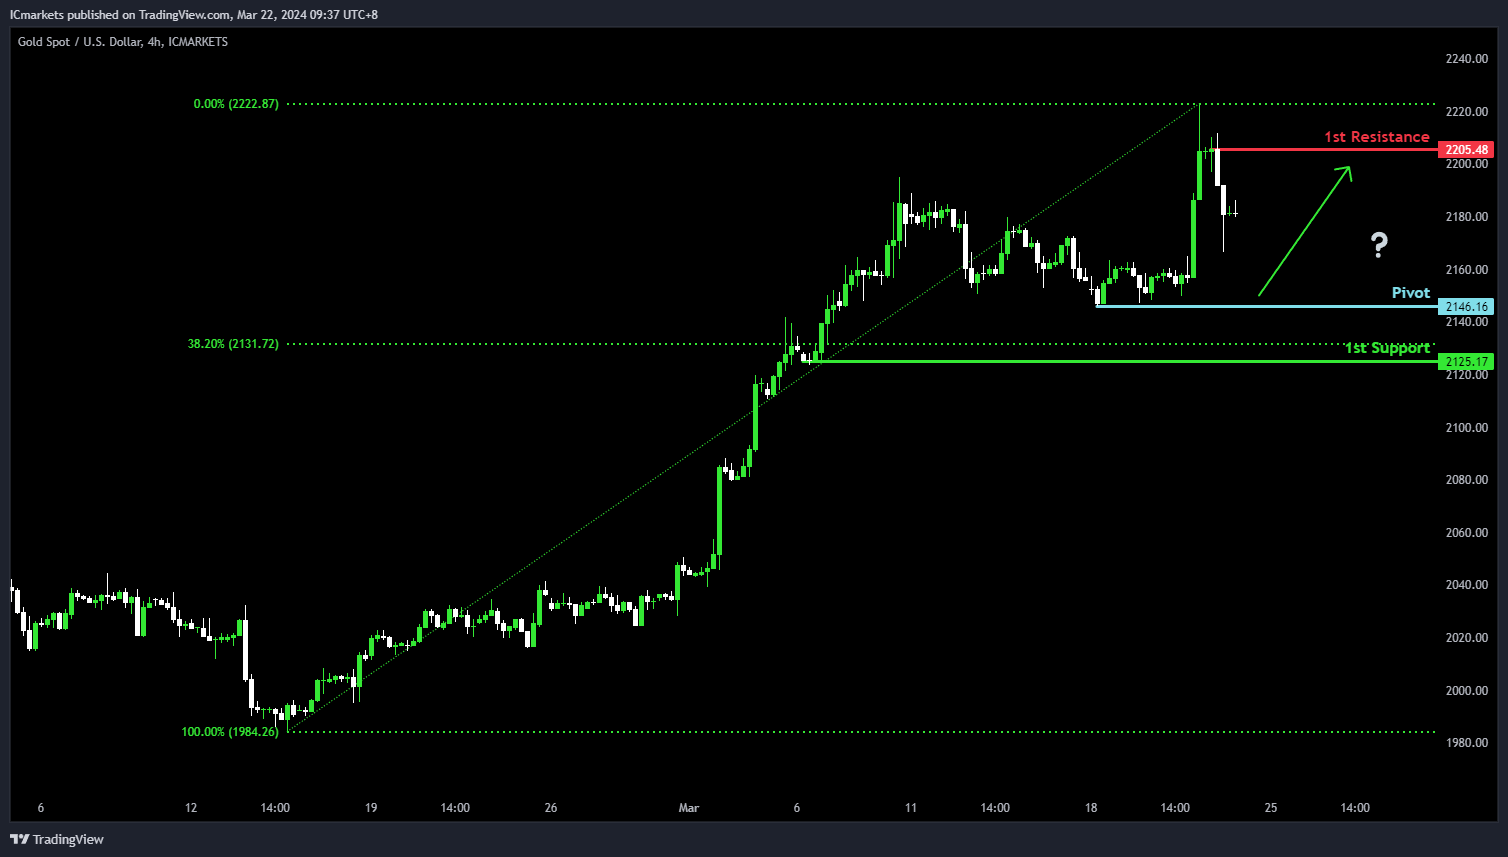
XAU/USD (GOLD):
The Gold (XAU/USD) chart currently demonstrates an overall bullish momentum. However, there is a potential scenario for price to fall towards the pivot before making a bullish bounce to rise towards the 1st resistance.
The pivot level at 2,146.16 is identified as a pullback support where price could potentially make a bullish bounce to climb higher. The 1st resistance level at 2,205.48 is noted as a pullback resistance that is situated close to the all-time high, further reinforcing its significance as a potential barrier to further bullish movement.
To the downside, the 1st support level at 2,125.17 is marked as a pullback support that aligns close to the 38.20% Fibonacci Retracement level, reinforcing its significance as a key support level.
USD/JPY Could Extend Rally As Dips Turn Attractive
Key Highlights
- USD/JPY rallied above the 148.80 and 150.00 resistance levels.
- A connecting bullish trend line is forming with support at 150.50 on the 4-hour chart.
- Crude oil prices corrected gains and traded below $81.50.
- Bitcoin attempted a fresh increase above the $65,000 resistance zone.
USD/JPY Technical Analysis
The US Dollar started a major increase against the Japanese Yen after the historic BoJ’s rate hike. USD/JPY rallied above the 148.80 resistance to move into a positive zone.
Looking at the 4-hour chart, the pair settled above the 150.00 level, the 100 simple moving average (red, 4-hour), and the 200 simple moving average (green, 4-hour). It tested the 151.80 resistance before there was a minor pullback.
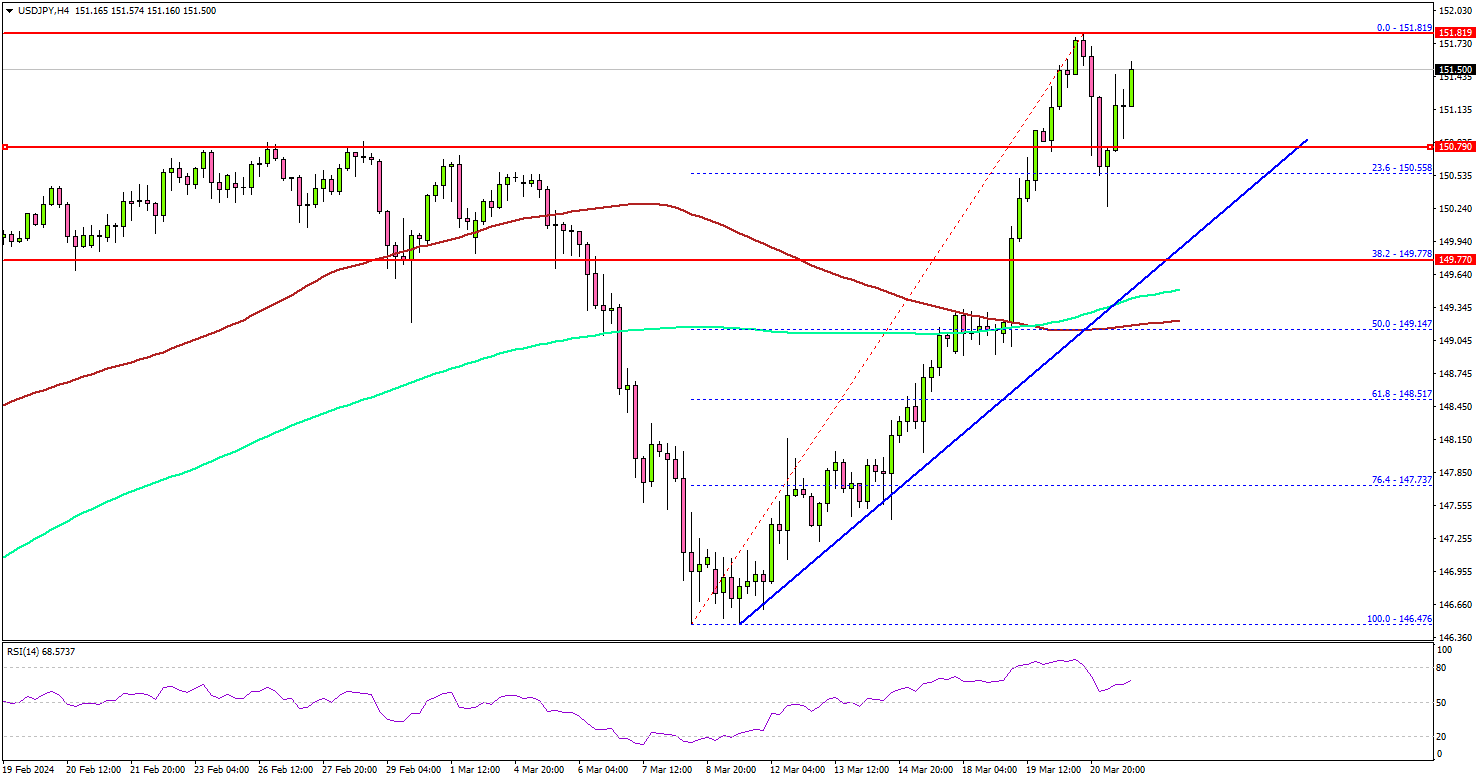
The pair tested the 150.50 support zone and the 23.6% Fib retracement level of the upward move from the 146.47 swing low to the 151.81 high.
There is also a connecting bullish trend line forming with support at 150.50 on the same chart. On the upside, the pair could face resistance near the 151.80 level. The first major resistance is now forming near 152.00.
A close above the 152.00 zone could open the doors for more upsides. The next stop for the bulls might be 155.00. If not, the pair might correct lower. Immediate support is near the 150.50 level and the trend line.
The next major support is at 149.80 or the 100 simple moving average (red, 4-hour). If there is a downside break below the 100 simple moving average (red, 4-hour), the pair could decline toward the 146.50 support.
Looking at Bitcoin, the bulls attempted a fresh increase above the $65,000 resistance but they are facing hurdles near $68,000.
Economic Releases
- UK Retail Sales for Feb 2024 (YoY) - Forecast -0.3%, versus +3.4% previous.
- UK Retail Sales for Feb 2024 (MoM) - Forecast -0.7%, versus +0.7% previous.
- German IFO Business Climate Index for March 2024 – Forecast 86.0, versus 85.5 previous.
- Federal Reserve Chair Jerome Powell’s speech.
Japan CPI core rises to 2.8% in Feb, above BoJ’s target for 23rd month
Japan's CPI core (ex-fresh food) rises from 2.0% yoy to 2.8% yoy in February, matched expectations. This increase marks the first acceleration in four months and maintains the index above BoJ's 2% target for the 23rd consecutive month.
The uptick in the core CPI was primarily due to a less pronounced decline in energy prices, reflecting diminishing impact of government subsidies introduced to mitigate energy costs. Specifically, energy prices saw a decrease of -1.7% yoy, a significant moderation from -12.1% yoy drop recorded in January.
The overall headline CPI also showed an uptick, accelerating from 2.2% yoy to 2.8%yoy. However, when examining CPI core-core, which excludes both food and energy, there was a slight slowdown from 3.5% yoy to 3.2% yoy.
New Zealand’s goods exports rises 16% yoy in Feb, imports up 3.3% yoy
In February, New Zealand's goods exports leaped by 16% yoy to NZD 5.9B. This surge contrasts with a more modest 3.3% yoy increase in goods imports, totaling NZD 6.1B. Consequently, monthly trade deficit narrowed significantly to NZD -218m, far exceeding market expectations of a shortfall of NZD -825m.
Exports to China, New Zealand's largest trading partner, increased by 10% yoy, contributing an additional NZD 154m. US saw a remarkable 52% yoy jump in exports, adding NZD 305m, while EU and Australia also recorded increases in New Zealand exports by 7.9% yoy and 5.9% yoy, respectively. However, trade with Japan contracted, with exports declining by -10% yoy.
On the import front, China and South Korea marked significant increases of 7.1% yoy and 42% yoy, respectively, indicating robust demand for goods from these economies. Conversely, imports from US and EU saw downturns, declining by 20% yoy and 7% yoy.