Sample Category Title
BoJ Ends Negative Interest Rate Regime
In focus today
We have a light schedule for today.
In the euro area, focus is on German ZEW data for March. The assessment of the current economic situation is still very poor while the expectations component has increased significantly. Momentum in the German economy is weak, so it will be interesting to see if this changed in March ahead of the PMIs on Thursday.
In Sweden, Deputy Governor Martin Flodén gives a lecture on the economic situation and current monetary policy at 14:00.
Economic and market news
What happened overnight
In Japan, the Bank of Japan (BoJ) has decided to set the overnight call rate as its new policy rate and guide it in a range of 0-0.1%, finally ending the era with negative interest rates. At the same time, it officially terminates yield curve control. BoJ does, however, promise to continue its JGB purchases at broadly the same pace and make nimble responses in case of rapid rate increases. The decision was taken with a 7-2 majority vote, with the opposing members asking for more time to see the wage outcome in smaller businesses, which was also our key argument why the BoJ would wait to move in April. At the same time, the central bank discontinues its ETF and J-REIT purchases. The move was largely priced in already and thus the market reaction has been modest, with USD/JPY trading higher from the 149.3 to 149.8 levels and the 10-year JGB-rate actually dropping a couple of basis points as central bank purchases remain intact.
We expect the BoJ to move cautiously from here and we do not see a steep hiking cycle ahead. BoJ will assess the situation meeting by meeting and might find room for a few more small hikes if wage growth on big business rubs off sufficiently on the SME segment.
In Australia, as anticipated by markets and consensus, the Reserve Bank of Australia (RBA) kept its policy rate at 4.35%. Previously, RBA had still explicitly maintained the door open for further hikes, but now they simply stated that 'the board is not ruling anything in or out', which the markets took as a relatively more dovish signal. Markets are now pricing in the first rate cut for the September meeting.
What happened yesterday
In the euro area, final HICP inflation figures for February confirmed the flash print. Hence, headline inflation rose 2.6% y/y, core 3.1% and food 4.0%, energy fell 3.7%, while services rose 4.0% and core goods rose 1.6%. In general, decomposing the print reveals that the disinflationary process continued, though the momentum in core services remained markedly high and ongoing, posing upside risks to the inflation outlook. Moreover, food inflation has finally started to approach the 2% target after being elevated for a long time.
In Norway, Mainland-GDP surprised to the upside, coming in at 0.4% m/m (cons: 0.1%), clearly higher than what Norges Bank (NB) estimated in the December MPR (-0.2%). Hence, the print hints toward some slightly hawkish tones ahead of the MPC-meeting on Thursday where we expect NB to keep the policy rate unchanged at 4.5%.
In the commodity space, Brent crude climbed to USD86/bbl, its highest level since November, amid Ukraine intensifying attacks on Russian energy infrastructure.
Equities: Global equities were higher yesterday with Europe being a notable underperformer despite a cyclical rotation and macroeconomic news if anything slightly supportive for Europe. In the US we saw a much more growth-cyclical rotation with communication services massively outperforming driven by mega cap GOOGL. Small caps underperformed after a strong Friday session. It is fascinating to see all the hype and frenzy playing around AI and large cap tech while more or less the opposite is taking place in small caps. Investors can easily agree that large cap AI-related tech looks expensive, but they dare not underweight them after a very strong run. Small caps look cheap and attractive, but no one dares to overweight them after a very long run with massive underperformance. In US yesterday, Dow +0.2%, S&P 500 +0.6%, Nasdaq +0.8% and Russell 2000 -0.7%. Asian markets are mixed this morning with Japan outperforming after a dovish hike from BoJ weakening the currency. US and European futures are lower this morning.
FI: Yields grinded marginally higher with limited new information as markets await the FOMC meeting tomorrow evening. The final inflation data from the euro area did not impact markets, however it showed some noteworthy trends as the domestic inflation gauge, on which Lagarde and ECB have focused a lot over the recent months, only declined marginally to 4.5% while also the PCCI indicator rose to above 2%. We do not think that ECB will deviate from delivering the first rate cut in June, however this clearly questions the number and pace of rate cuts that will follow. Markets are pricing the June cut at 19bp and 84bp by year end.
FX: USD/JPY jumped immediately after the BoJ announced an end to its negative rate policy and yield curve control. EUR/USD fell below 1.09 ahead of tomorrow's FOMC meeting. AUD/USD dropped after the RBA removed its tightening bias.
RBA on Hold, Ruling Nothing In or Out
As was widely expected, the RBA Board left the cash rate on hold at its late-March meeting, at 4.35%. The language of the media release and press conference confirms that the Board is most likely on hold for a while yet.
As was widely expected, the RBA Board left the cash rate on hold at its late-March meeting, at 4.35%.
There were two key changes in the language in the final paragraph. The first was the switch from ‘a further increase in interest rates cannot be ruled out’, to ‘the Board is not ruling anything in or out’ – language taken from the media conference last month. The second was the elimination of the language ‘and will do what is necessary to achieve that outcome’.
This second deletion is particularly significant: versions of this language have been in the media release ever since the first increase in the cash rate this cycle, back in May 2022. The media release after that meeting read, ‘The Board is committed to doing what is necessary to ensure that inflation in Australia returns to target over time.’
The implication here is that the Board no longer needs to commit to doing what is needed, because no additional action is needed to achieve the desired outcome. With these deletions, what remains in the media release are the words of a central bank that is on hold, but not quite willing to say so outright. In the press conference, the Governor did not explicitly indicate whether a rate increase was considered in this week’s meeting, but rather highlighted that the Board always considers a range of possibilities.
By saying it is not ruling anything in or out, the Board is flagging the possibility that some shock could still derail the current trajectory of declining inflation and require a rate hike. But there is no sign of this occurring. The media release highlighted the ‘encouraging signs that inflation is moderating’ and the slow growth confirmed by the national accounts. The paragraphs on the outlook and the text on inflation expectations were unchanged from the February meeting. The overall message was of a disinflation that is on track.
There were no changes in the text in response to the recent upside surprises in inflation in the United States. The Board had already been highlighting the persistent services inflation overseas, and presumably concluded that it was already exercising the required amount of caution in this area.
The Board also remains cautious on the issue of labour costs. Although it acknowledges that wages growth appears to have peaked and productivity growth has picked up, the media release highlighted that at current rates, wages growth remains consistent with the inflation target, ‘only on the assumption that productivity growth increases to around its long-run average’. The word ‘only’ was inserted into the statement this month. As we at Westpac Economics have been highlighting for some months, most recently in Senior Economist Pat Bustamante’s note last week and accompanying video, there are good reasons to expect that productivity growth will recover. But the RBA Board is not yet ready to assume that this recovery will occur.
In the press conference, the Governor reiterated the importance of holding on to the gains in the labour market. The RBA continues to expect employment to increase, but more slowly than the labour force will. The unemployment rate is therefore forecast to rise.
The Board’s priority is still to ensure that inflation returns to the 2–3% target range. But the flow of recent data suggests that (absent some shock) no further rate hikes are needed to achieve this. The text of the media release suggests that the Board recognises that.
Given that recent data flow and the shift in the RBA’s language, we continue to expect that the RBA is on hold until its late-September meeting. At that point, it will have the full suite of data for the first half of 2024, including productivity and labour cost growth. Assuming things continue to pan out as expected, it will then have enough assurance that inflation will continue to decline on the desired trajectory. That will allow the Board to reduce some of the tightness in the stance of monetary policy and preserve more of the gains on employment.
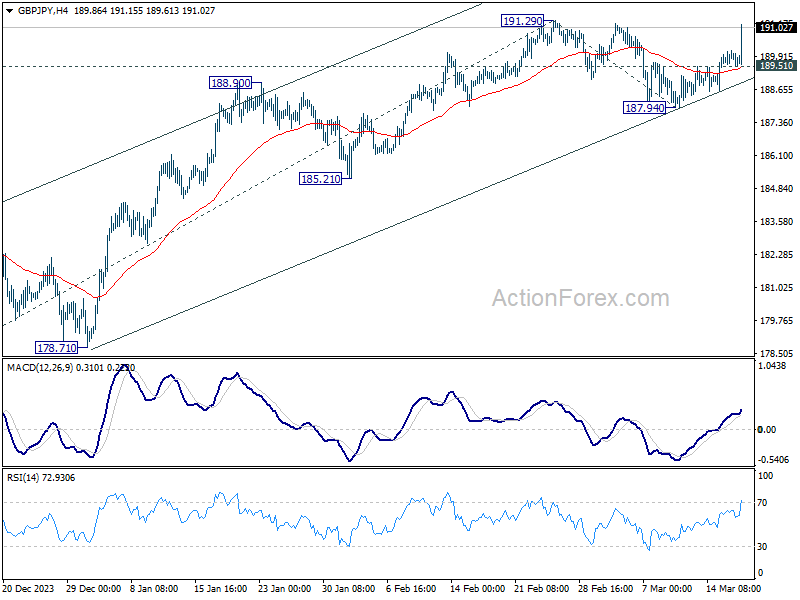
GBP/JPY Daily Outlook
Daily Pivots: (S1) 189.55; (P) 189.86; (R1) 190.17; More.....
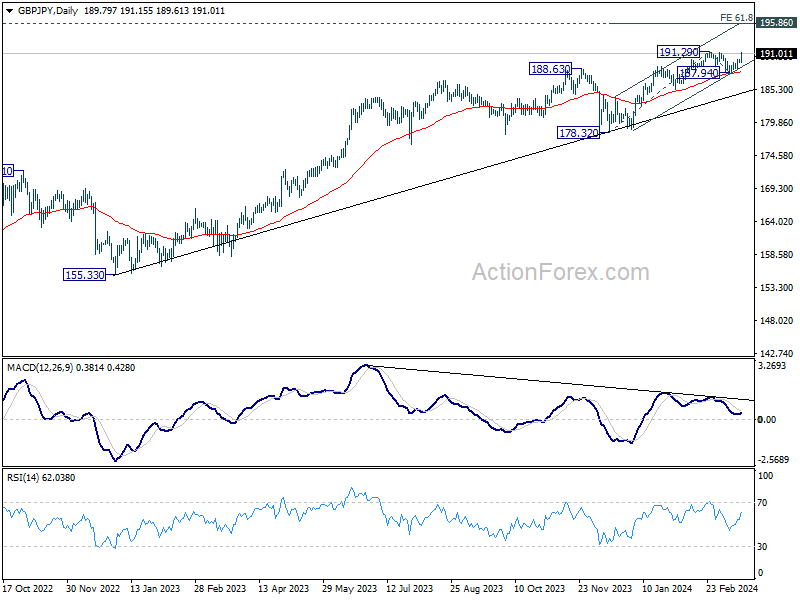
GBP/JPY's rally from 187.94 accelerates higher today and intraday bias stays on the upside. Decisive break of 191.29 will confirm resumption of larger up trend. Next near term target will be 61.8% projection of 178.32 to 191.29 from 187.94 at 195.95, which is close to 195.86 long term resistance. On the downside, below 189.51 minor support will delay the bullish case and turn intraday bias neutral first.
In the bigger picture, up trend from 123.94 (2020 low) is in progress. Medium term outlook will stay bullish as long as 178.32 support holds. Next target is 195.86 long term resistance (2015 high).
EUR/JPY Daily Outlook
Daily Pivots: (S1) 161.86; (P) 162.27; (R1) 162.59; More...
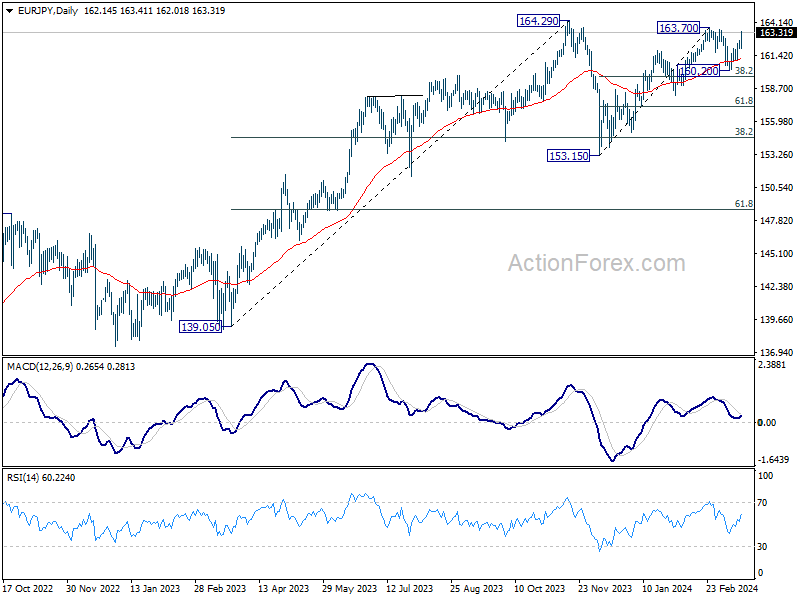
EUR/JPY's rally from 160.20 accelerates higher today and intraday bias stays on the upside for 163.70 resistance. Decisive break there will resume larger rally from 153.15 for 164.29 high. On the downside, below 161.94 minor support will delay the bullish case and turn intraday bias neutral first. But outlook will stay bullish as long as 160.20 support holds.
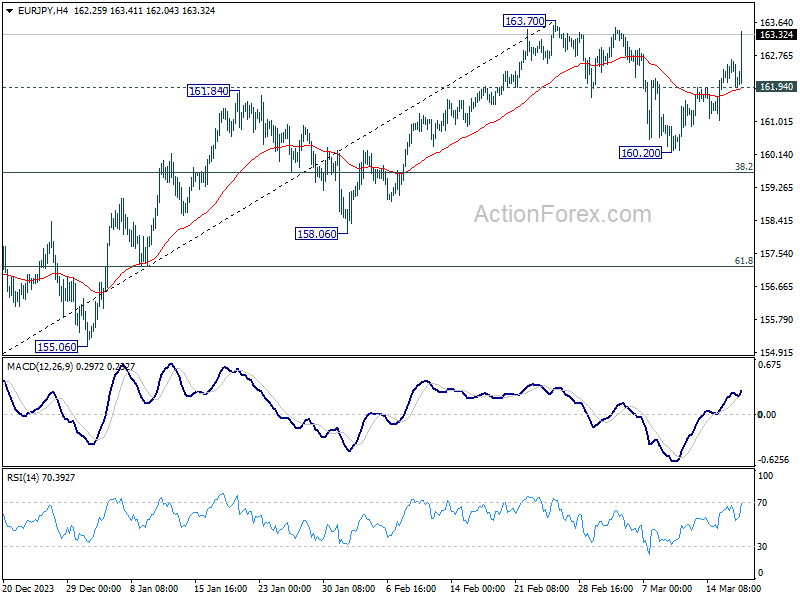
In the bigger picture, price actions from 164.29 medium term top are seen as a correction to rise from 139.05 which could still be extending. As long as 148.38 resistance turned support holds (2022 high), larger up trend from 114.42 (2020 low) is expected to resume through 164.29 at a later stage. Next target would be 169.96 (2008 high).
EUR/GBP Daily Outlook
Daily Pivots: (S1) 0.8533; (P) 0.8548; (R1) 0.8556; More...
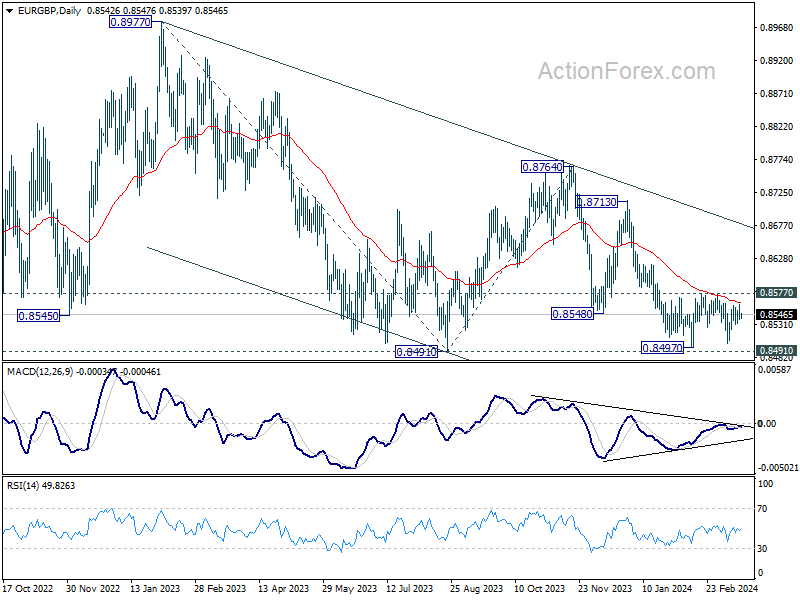
No change in EUR/GBP's outlook as range trading continues. Intraday bias remains neutral. On the downside decisive break of 0.8491/7 support zone will confirm larger down trend resumption and target 0.8464 projection level first. However, firm break of 0.8577 will turn bias back to the upside for stronger rebound.
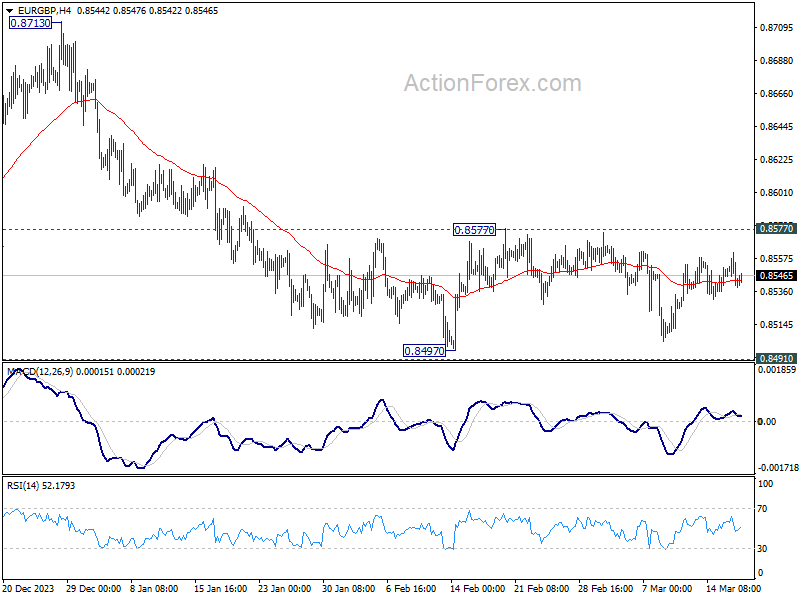
In the bigger picture, fall from 0.8764 is seen as another leg in the whole down trend from 0.9267 (2022 high). Outlook will stay bearish as long as 0.8713 resistance holds. Break of 0.8491 will target 61.8% projection of 0.8977 to 0.8491 from 0.8764 at 0.8464.
EUR/AUD Daily Outlook
Daily Pivots: (S1) 1.6561; (P) 1.6584; (R1) 1.6597; More...
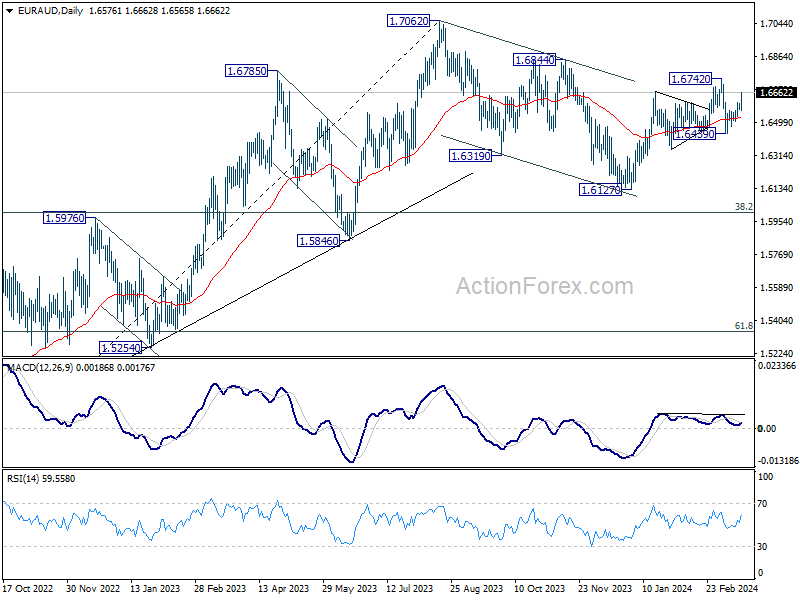
EUR/AUD's strong break of 1.6606 minor resistance indicates that corrective pullback from 1.6742 has completed at 1.6439. Intraday bias is back on the upside for retesting 1.6742 first. Firm break there will resume whole rise from 1.6127 and 1.6844 resistance next. For now, near term outlook will remain cautiously bullish as long as 1.6439 support holds, in case of retreat.
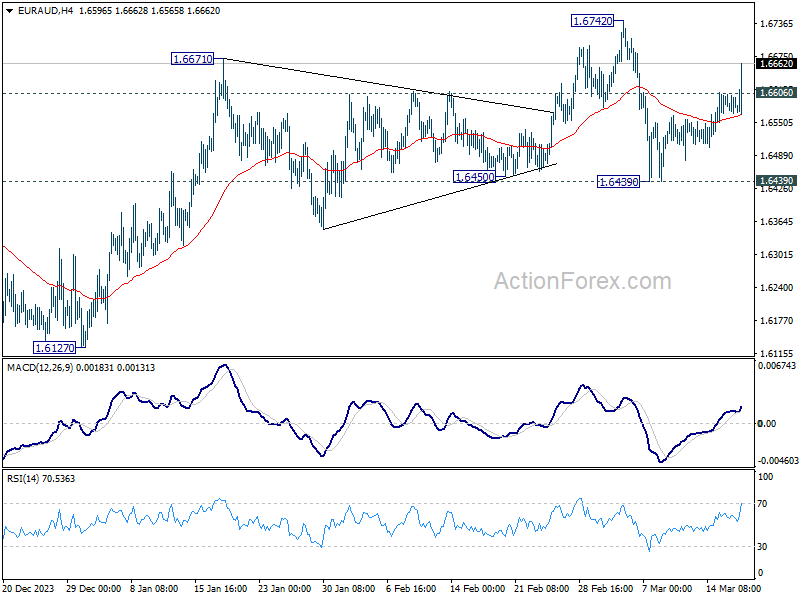
In the bigger picture, fall from 1.7062 medium term top is seen as a correction to the up trend from 1.4281 (2022 low). Break of 1.6844 resistance will argue that this up trend is ready to resume through 1.7062 high. In case of another fall, strong support should be seen around 1.5846 and 38.2% retracement of 1.4281 to 1.7062 at 1.6000 to bring rebound.
EUR/CHF Daily Outlook
Daily Pivots: (S1) 0.9626; (P) 0.9641; (R1) 0.9669; More...
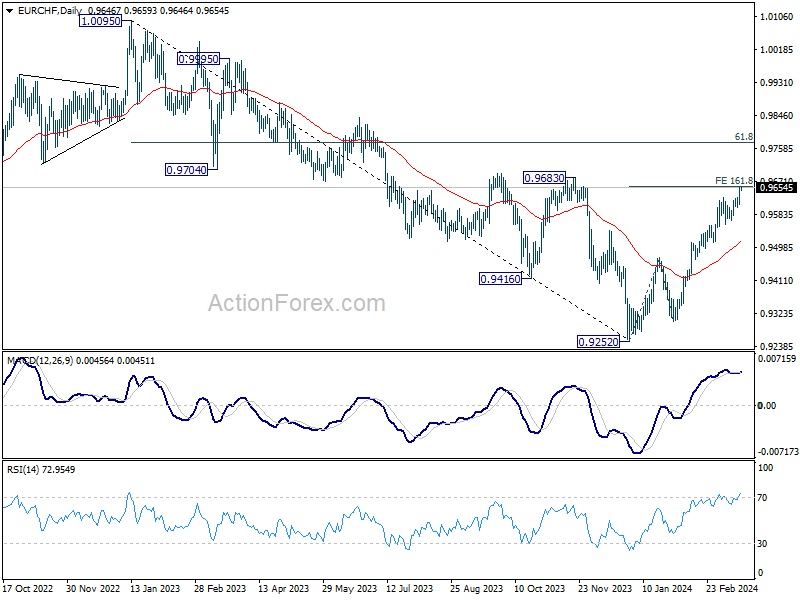
EUR/CHF's rally from 0.9252resumed by breaking through 0.9630 and intraday bias is back on the upside. 161.8% projection of 0.9252 to 0.9471 from 0.9304 at 0.9658 is already met but there is no sign on topping yet. Sustained break of 0.9658 will target 0.9683 key resistance next. On the downside, break of 0.9557 support is needed to indicate short term topping. Otherwise, outlook will stay cautiously bullish in case of retreat.
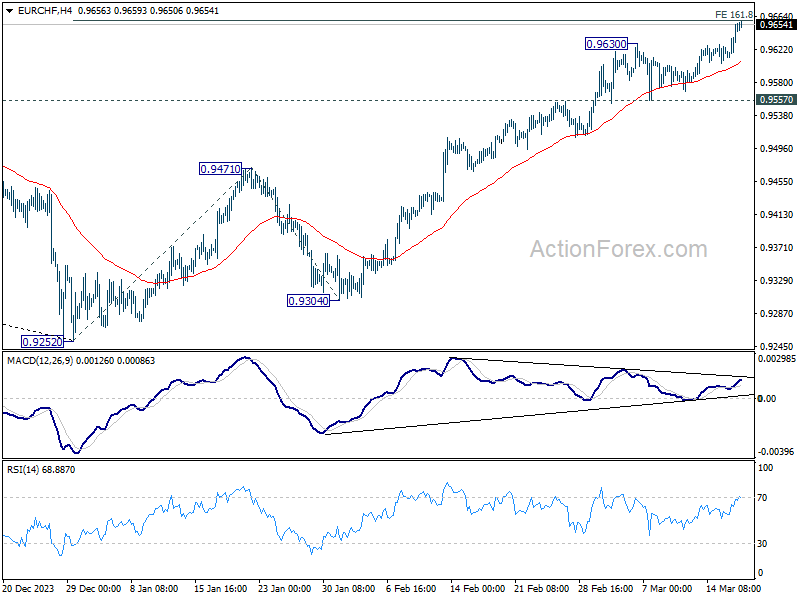
In the bigger picture, as long as 0.9683 resistance holds, rebound from 0.9252 are seen as a corrective move only. Larger down trend is expected to resume through 0.9252 after the correction completes. However, firm break of 0.9683 and sustained trading above 55 W EMA (now at 0.9620) will argue that 0.9252 is already a medium term bottom. Stronger rise would then be seen 61.8% retracement of 1.0095 to 0.9252 at 0.9773 and above.
Technical Outlook and Review
DXY:
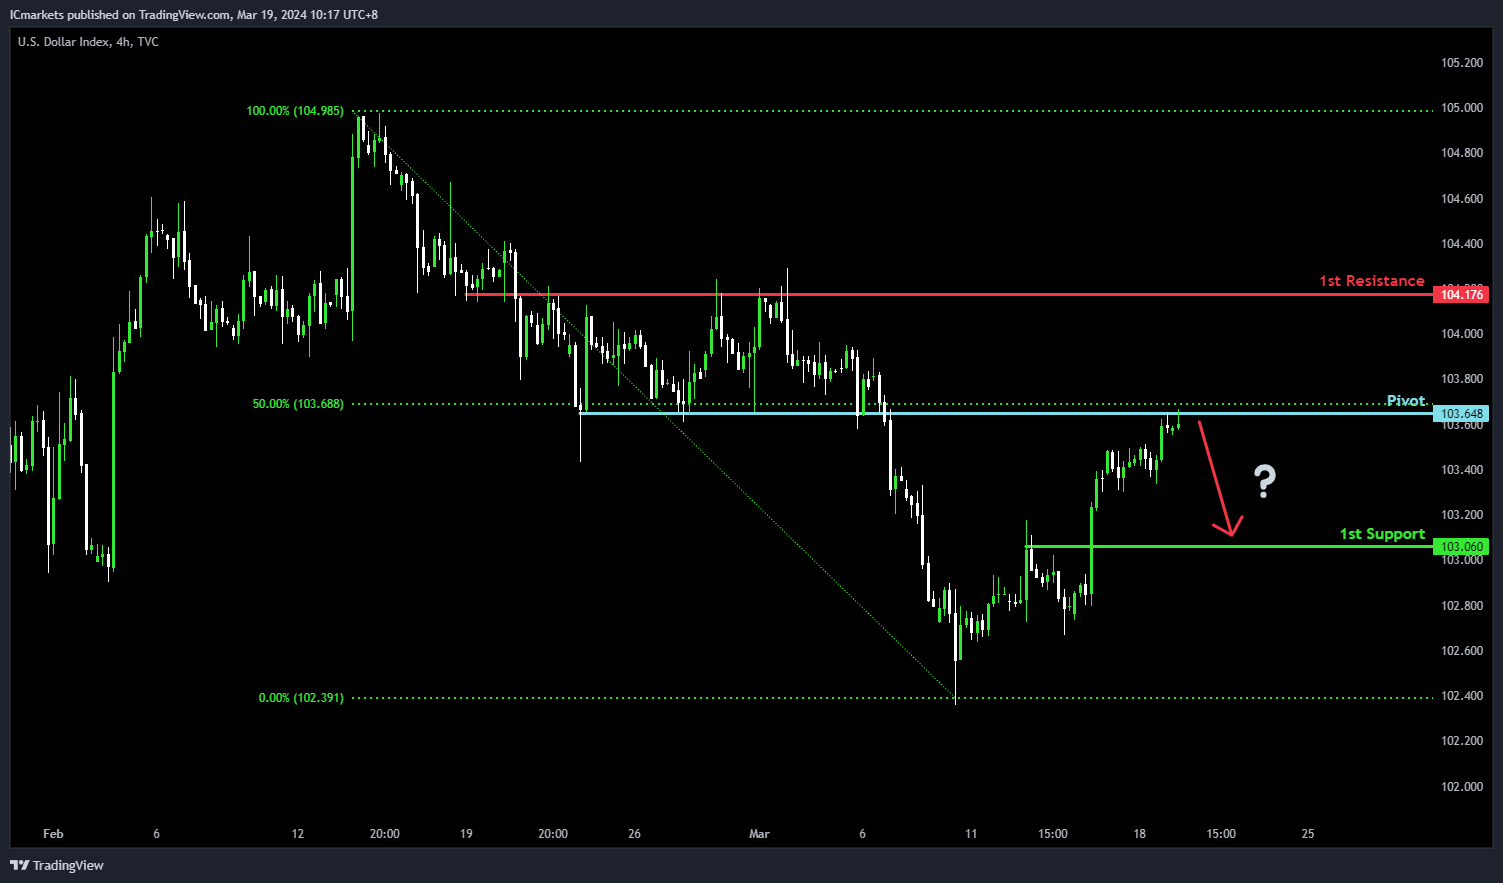
For DXY (US Dollar Index), the potential direction is bearish, aligning with the overall bearish momentum of the chart. There’s a possibility of a bearish reaction off the pivot level, leading to a drop towards the 1st support.
The pivot at 103.64 is significant, marked by an overlap resistance and the presence of the 50% Fibonacci Retracement, indicating a strong level where selling pressure might intensify. Additionally, the 1st support at 103.06 acts as pullback support, suggesting a zone where buying interest could emerge, potentially halting the downward movement.
On the resistance side, the 1st resistance at 104.17 forms another barrier, supported by an overlap resistance, indicating a level where selling pressure could increase, potentially limiting further upward movement in the price.
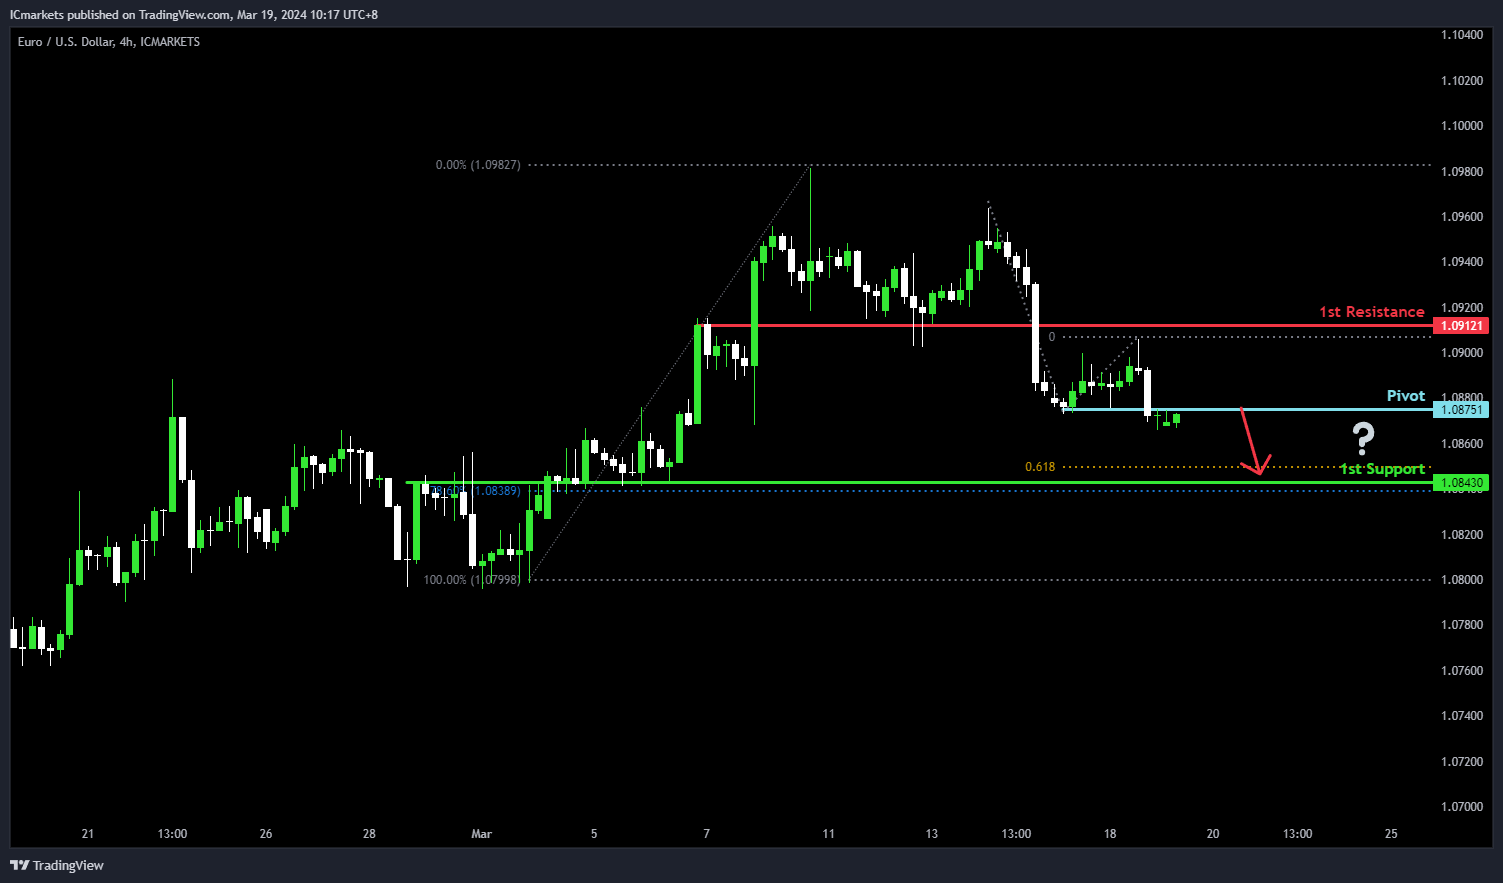
EUR/USD:
For EUR/USD, the potential direction is bearish, consistent with the overall bearish momentum of the chart. There’s a likelihood of a bearish reaction off the pivot level, potentially leading to a drop towards the 1st support.
The pivot at 1.0875 is notable, identified as an overlap resistance, suggesting a significant level where selling pressure might intensify. Additionally, the 1st support at 1.0843 acts as overlap support, reinforced by the presence of the 78.60% Fibonacci Retracement, indicating a level where buying interest could emerge, potentially halting the downward movement.
On the resistance side, the 1st resistance at 1.0912 serves as pullback resistance, suggesting a zone where selling pressure could increase, potentially limiting further upward movement in the price.
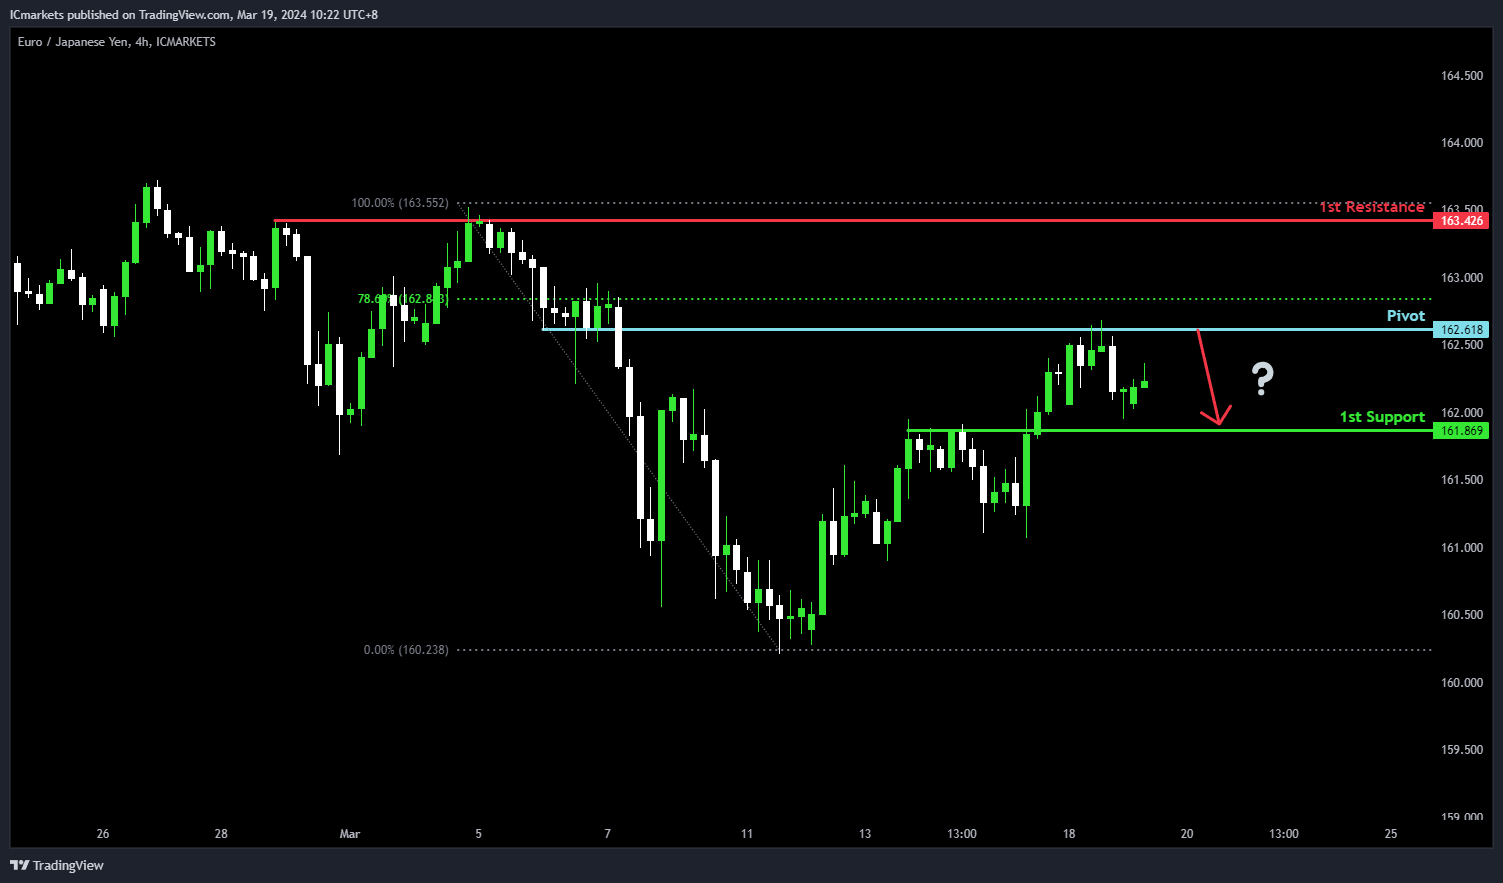
EUR/JPY:
For EUR/JPY, despite the overall bullish momentum of the chart, there’s a potential scenario indicating a bearish reaction off the pivot level, potentially leading to a drop towards the 1st support.
The pivot at 162.61 serves as a notable level of overlap resistance, suggesting a significant barrier where selling pressure might intensify. On the downside, the 1st support at 161.86 is identified as pullback support, indicating a level where buyers may intervene, potentially halting the downward movement.
Additionally, the 1st resistance at 163.42 presents a barrier to upward movement, supported by multi-swing high resistance, potentially reinforcing the bearish sentiment.
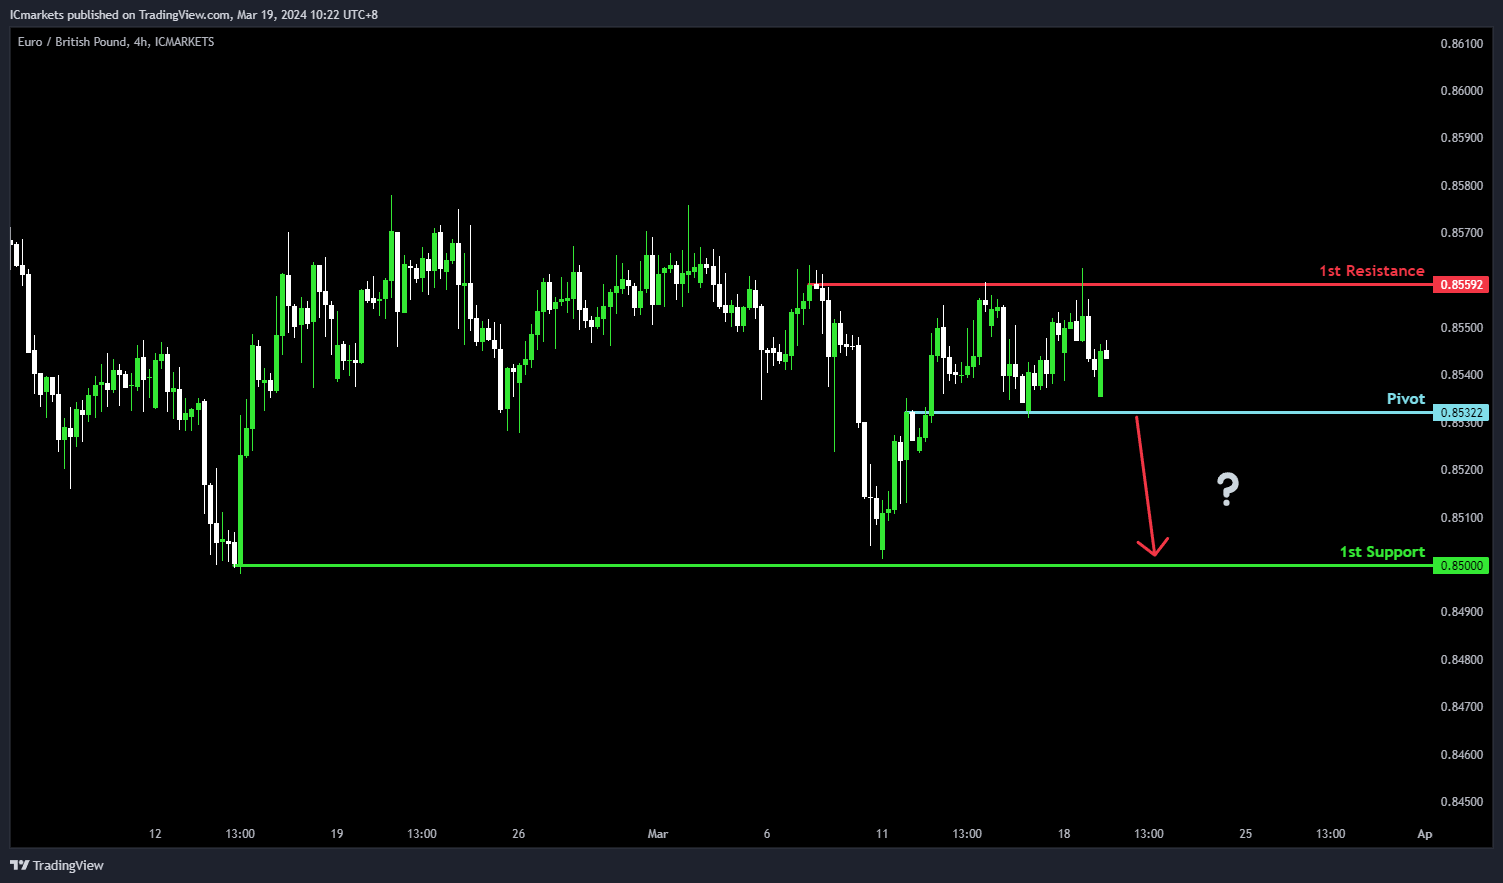
EUR/GBP:
For EUR/GBP, the potential direction is neutral, aligning with the overall neutral momentum of the chart. There’s a possibility that the price may fluctuate between the 1st resistance and 1st support levels.
The pivot at 0.8532 is identified as an overlap support, indicating a level of historical significance where buyers have intervened in the past. This level may act as a pivotal point for price movements.
The 1st support at 0.8500 serves as a swing low support, suggesting a level where buying interest could potentially increase, preventing further downward movement.
Conversely, the 1st resistance at 0.8559 presents a barrier to upward movement, supported by multi-swing high resistance, potentially limiting further upward movement in the price.
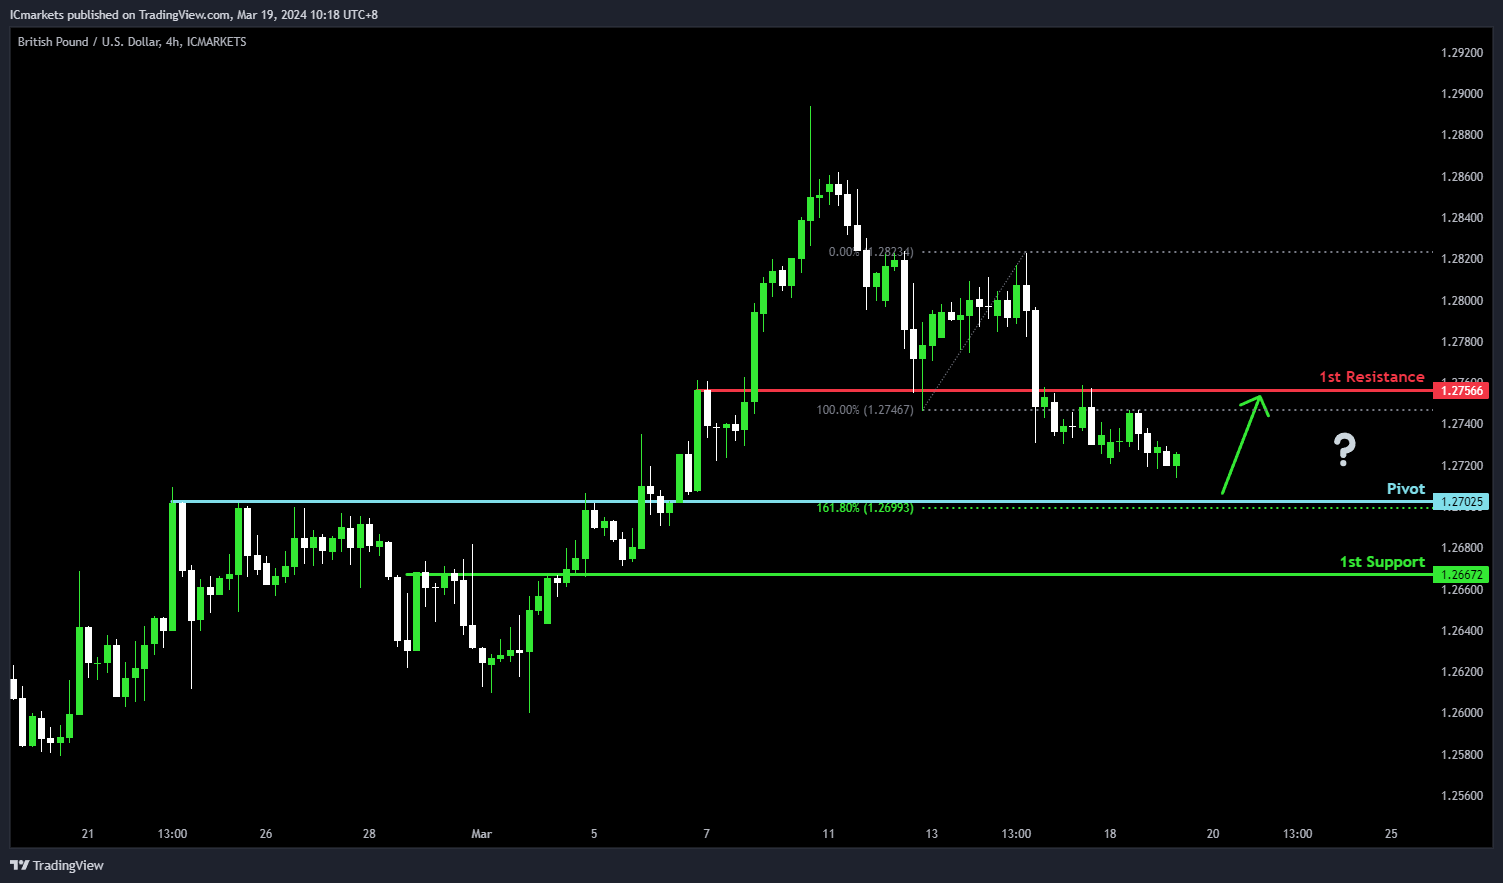
GBP/USD:
For GBP/USD, although the potential direction is stated as bearish, the scenario outlined suggests a bullish bounce off the pivot level towards the 1st resistance.
The pivot at 1.2702 is identified as pullback support, indicating a level where buyers might intervene, potentially leading to a bullish rebound. Additionally, the 1st support at 1.2667 acts as overlap support, reinforced by the presence of the 78.60% Fibonacci Retracement, suggesting a significant level where buying interest could emerge.
On the resistance side, the 1st resistance at 1.2756 serves as an overlap resistance, suggesting a zone where selling pressure might intensify, potentially limiting further upward movement in the price.
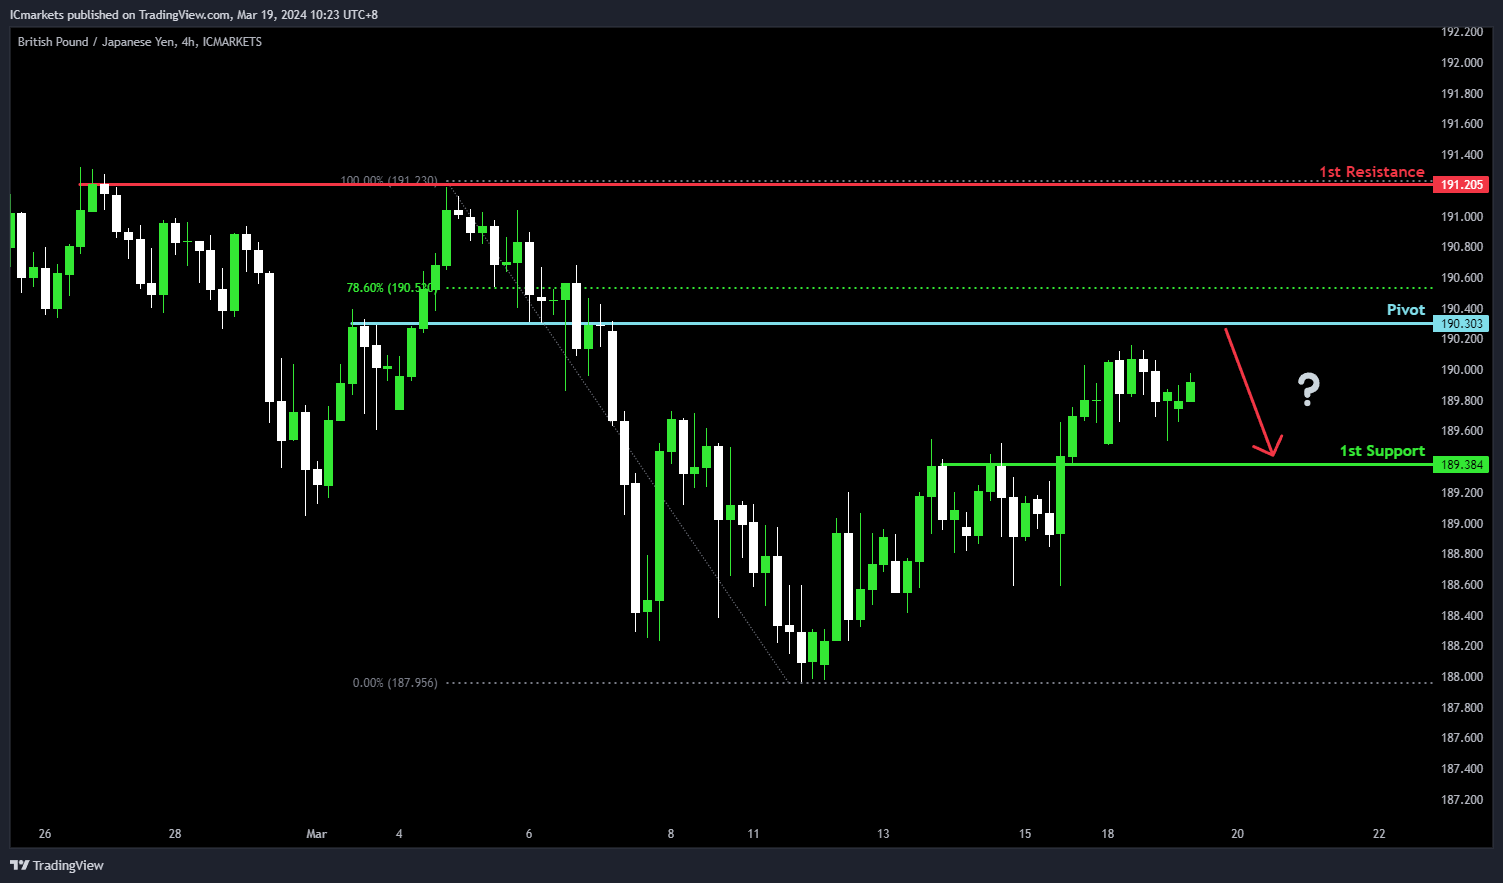
GBP/JPY:
For GBP/JPY, the potential direction is bearish, although the overall momentum of the chart remains bullish. There’s a scenario where the price could potentially experience a bearish reaction off the pivot level, leading to a drop towards the 1st support.
The pivot at 190.30 is identified as an overlap resistance, suggesting a significant level where selling pressure might increase, potentially prompting a bearish move.
On the support side, the 1st support at 189.38 serves as an overlap support, indicating historical significance as a level where buyers have intervened in the past.
Conversely, the 1st resistance at 191.20 presents a barrier to upward movement, supported by multi-swing high resistance, suggesting a level where selling pressure might intensify, potentially limiting further upward movement in the price.
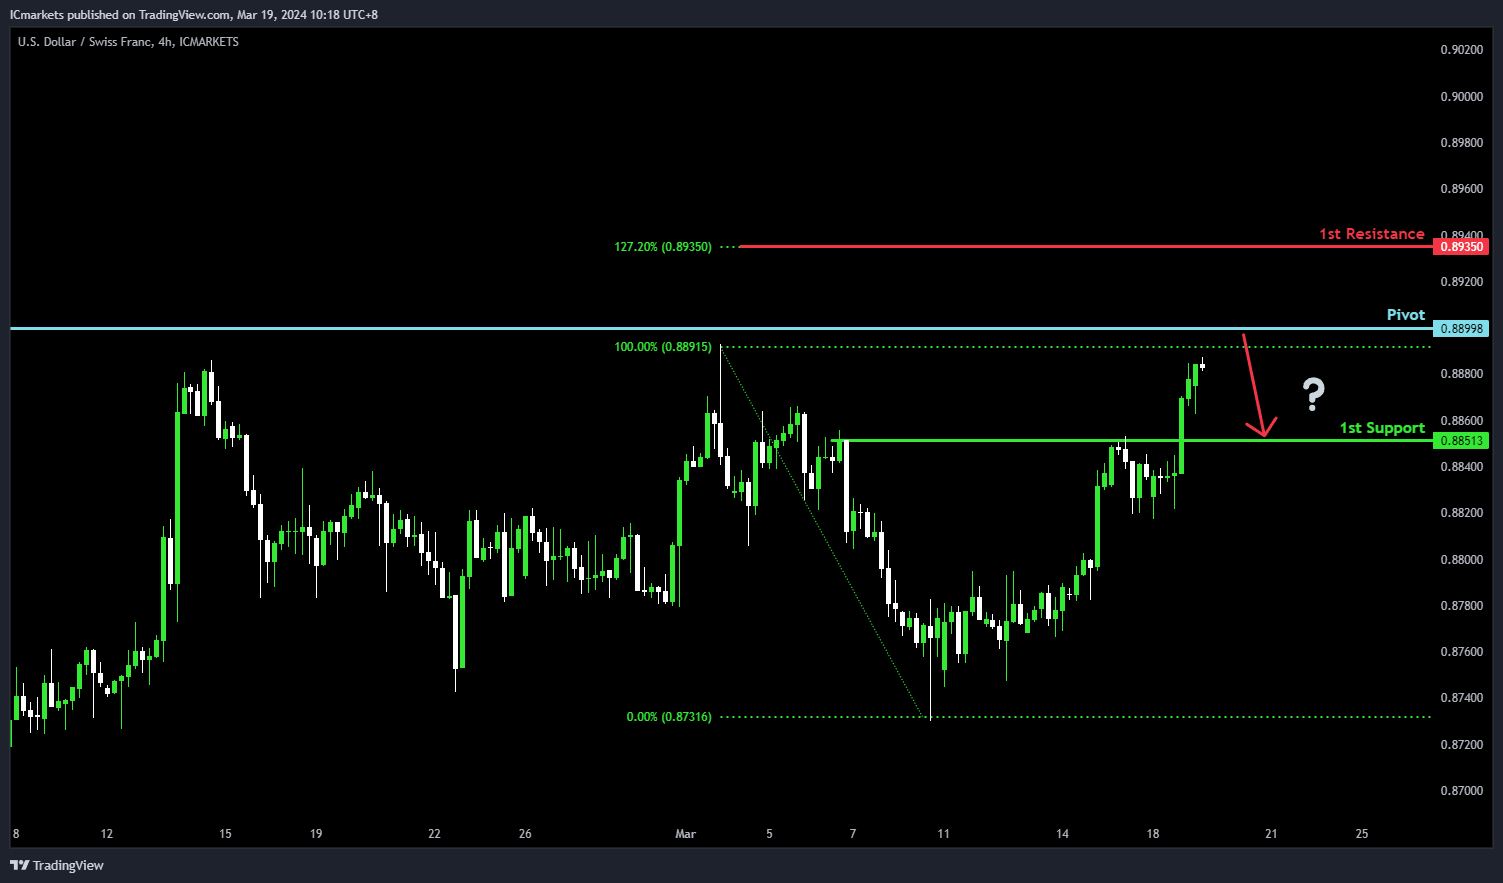
USD/CHF:
For USD/CHF, despite the overall momentum of the chart being bullish, there’s a potential scenario indicating a bearish reaction from the pivot level towards the 1st support.
The pivot at 0.8899 is marked by an overlap resistance, suggesting a significant level where selling pressure might intensify, potentially leading to a bearish pullback. Conversely, the 1st support at 0.8851 is identified as pullback support, indicating a level where buying interest could emerge, potentially halting the downward movement.
On the resistance side, the 1st resistance at 0.8935 is supported by the 127.20% Fibonacci Extension, forming a barrier to upward movement, potentially reinforcing the bearish sentiment.
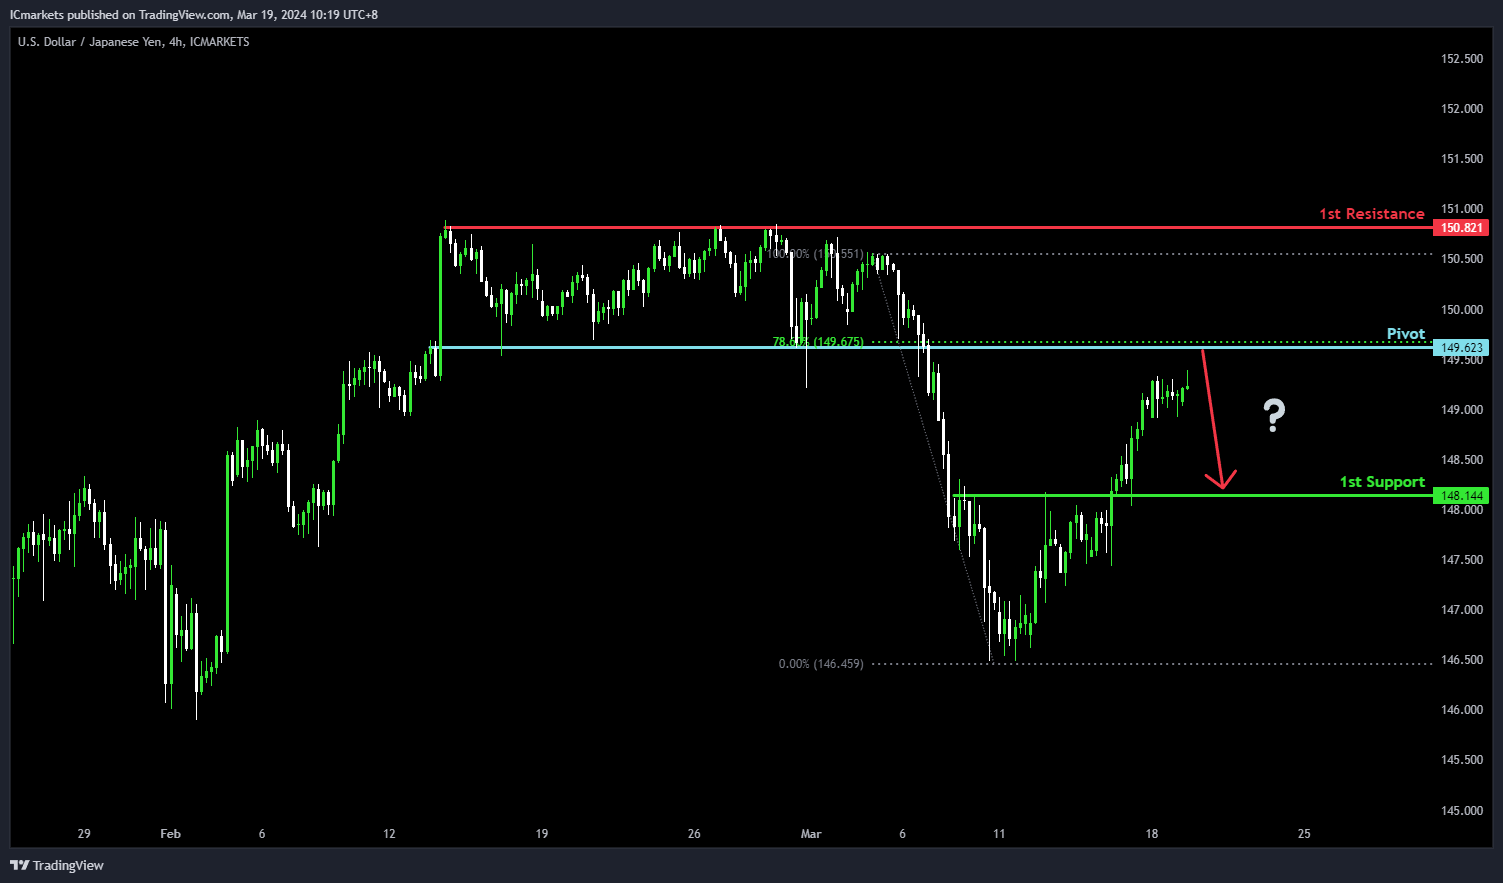
USD/JPY:
For USD/JPY, in line with the overall bearish momentum of the chart, there’s a potential scenario indicating a bearish reaction from the pivot level, possibly leading to a drop towards the 1st support.
The pivot at 149.62 is significant, identified as pullback resistance, with reinforcement from the 78.60% Fibonacci Retracement. This suggests a pivotal level where selling pressure might increase. Additionally, the 1st support at 148.14 serves as overlap support, indicating historical significance.
On the resistance side, the 1st resistance at 150.82 is noted as multi-swing high resistance, forming another barrier to upward movement, potentially reinforcing the bearish sentiment.
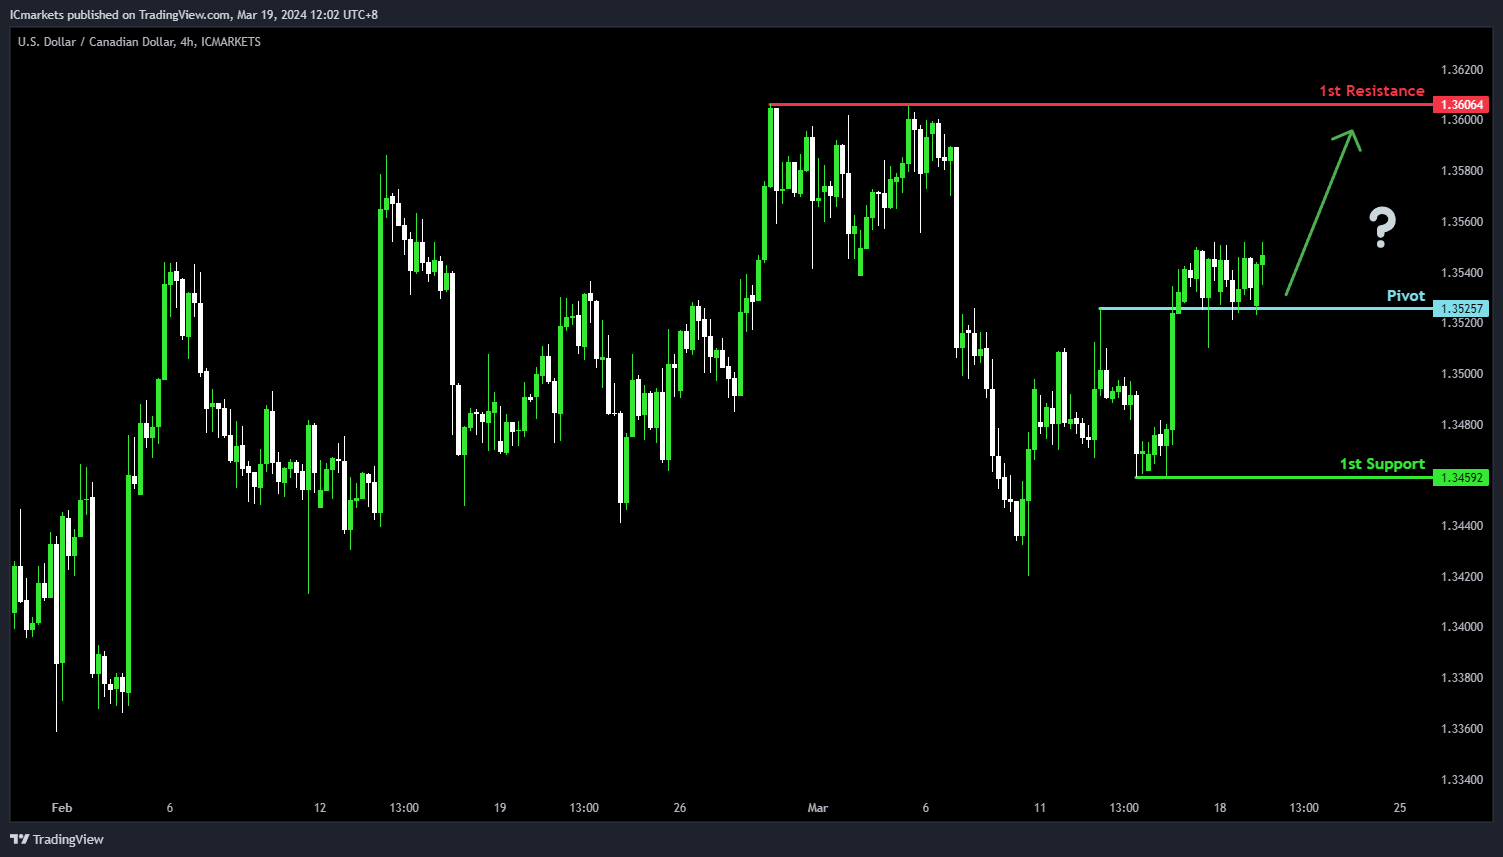
USD/CAD:
The USD/CAD chart currently demonstrates an overall bullish momentum. In this context, there is a potential scenario for price to fall towards the pivot and make a bullish bounce to rise towards the 1st resistance.
The pivot level at 1.3525 is identified as an overlap support where price could potentially make a bullish bounce and climb higher. The 1st resistance level at 1.3606 is noted as a pullback resistance, further highlighting its importance as a potential resistance zone.
To the downside, the 1st support level at 1.3459 is marked as a pullback support, reinforcing its significance as a key support level.
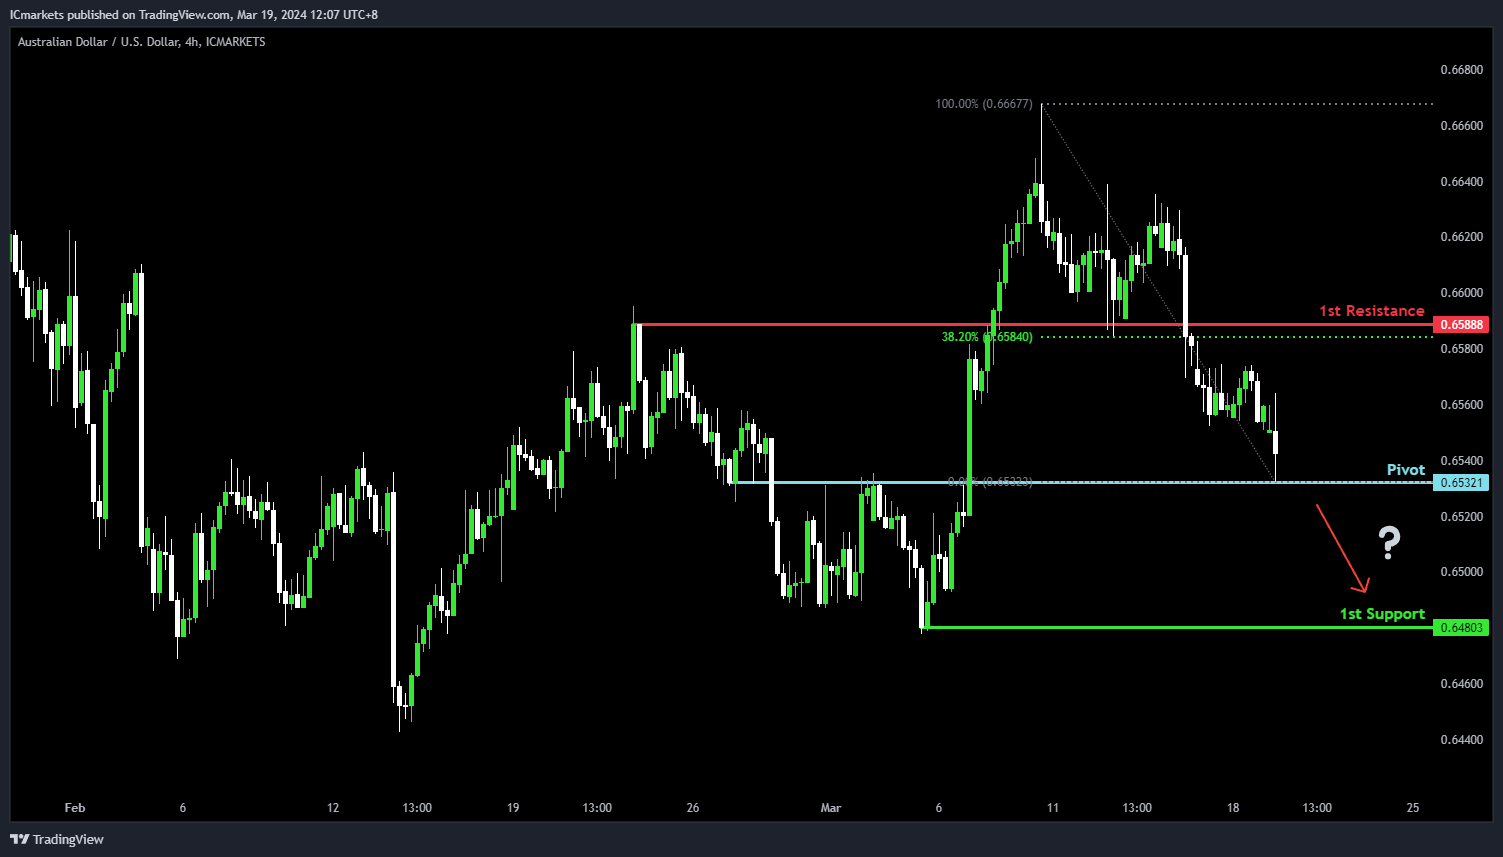
AUD/USD:
The AUD/USD chart currently demonstrates an overall bearish momentum. In this context,there is a potential scenario for price to break below the pivot and potentially drop towards the 1st support.
The pivot level at 0.6532 is identified as an overlap support where price could potentially break under to drop lower. The 1st support level at 0.6480 is marked as a pullback support, reinforcing its significance as a key support level.
On the resistance side, the 1st resistance level at 0.6588 is noted as an overlap resistance that aligns close to the 38.20% Fibonacci Retracement level, potentially limiting any further upward movement.
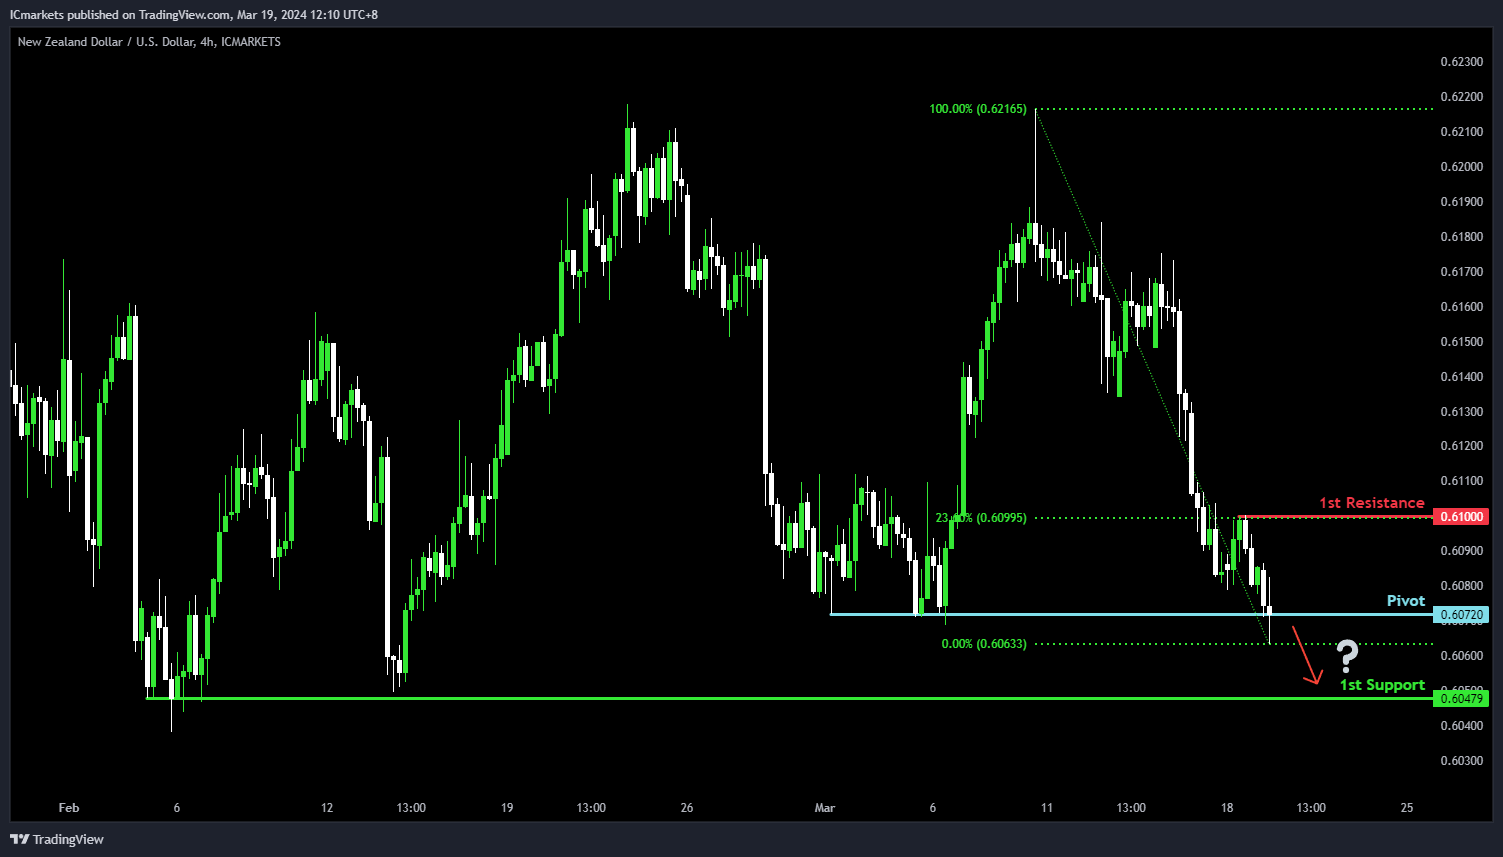
NZD/USD
The NZD/USD chart currently demonstrates an overall bearish momentum. In this context, there is a potential scenario for price to break below the pivot and potentially drop towards the 1st support.
The pivot level at 0.6072 is identified as a pullback support where price could potentially break under to drop lower. The 1st support level at 0.6047 is marked as a multi-swing-low support, reinforcing its significance as a key support level.
On the resistance side, the 1st resistance level at 0.6100 is noted as a pullback resistance that aligns with the 23.60% Fibonacci Retracement level, potentially limiting any further upward movement.
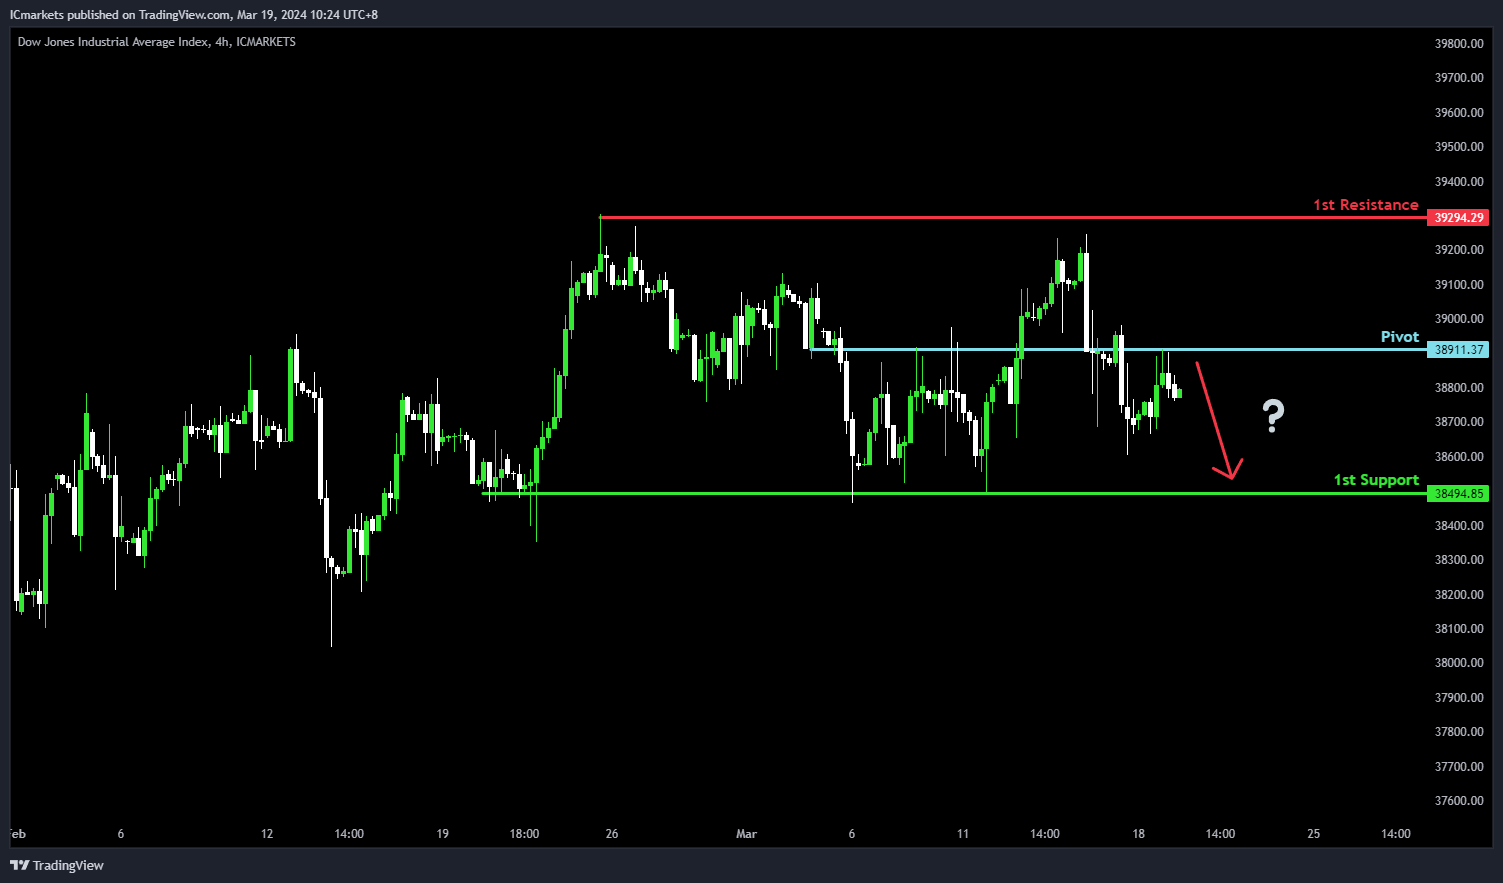
DJ30:
For DJ30, despite the bullish overall momentum, the potential direction is bearish. There’s a chance for a bearish continuation towards the 1st support.
The pivot at 38911.37 acts as an overlap resistance, suggesting possible increased selling pressure. The 1st support at 38494.85, a multi-swing low support, signifies historical buying interest.
Conversely, the 1st resistance at 39294.29 forms a swing-high resistance, potentially impeding further bullish movement.
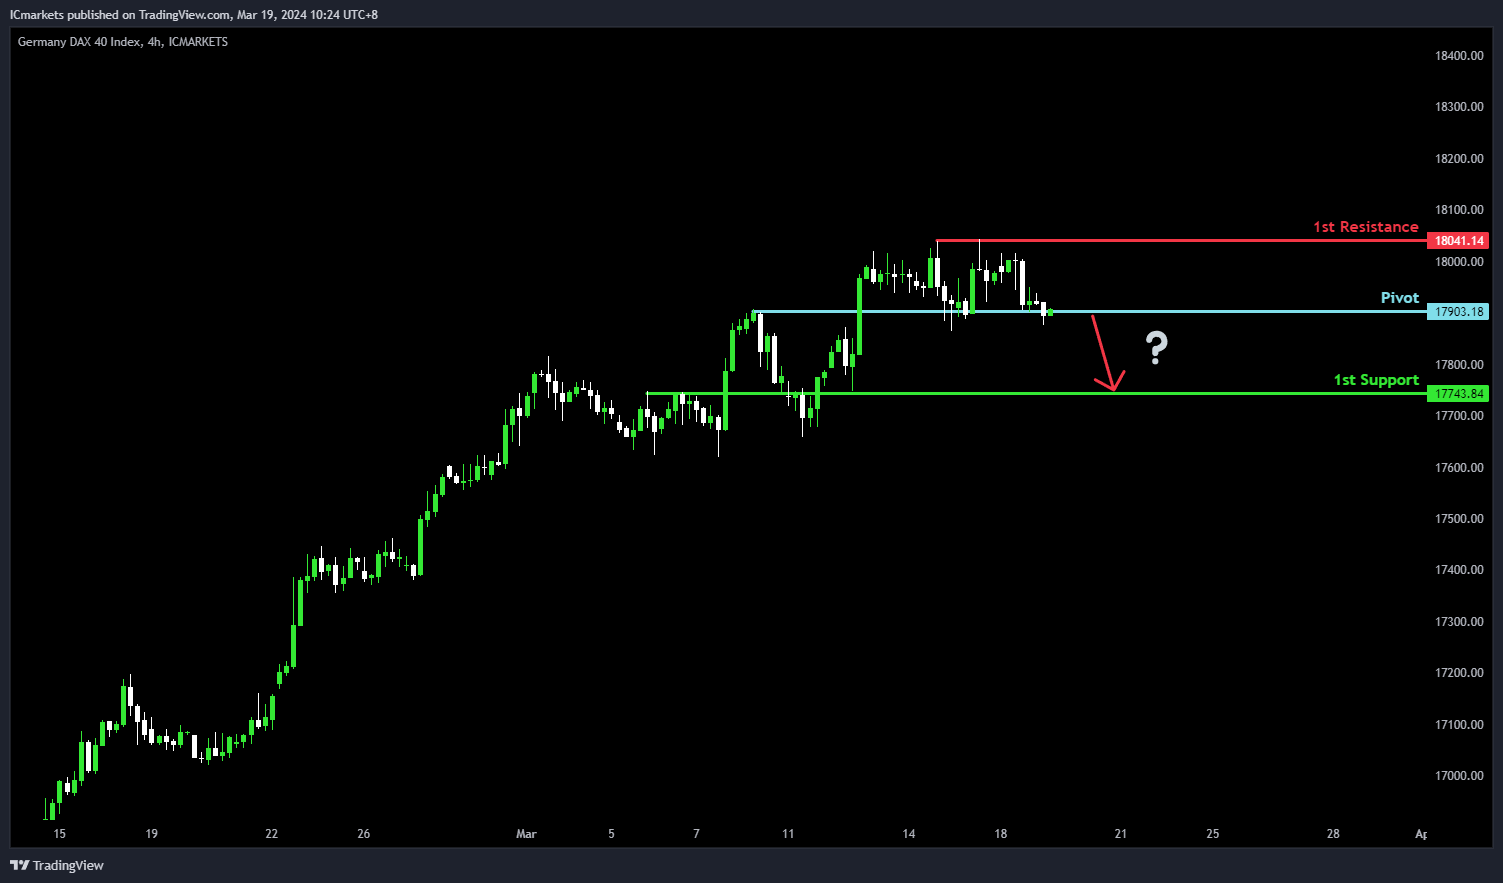
GER40:
For GER40, despite the bullish overall momentum, the potential direction is bearish. There’s a possibility of a bearish reaction off the pivot level, leading to a drop towards the 1st support.
The pivot at 17903.18 serves as an overlap resistance, indicating a potential area of selling interest. The 1st support at 17743.84 acts as an overlap support, historically significant for buying activity.
Conversely, the 1st resistance at 18041.14 represents a multi-swing high resistance, potentially hindering further bullish advancement.
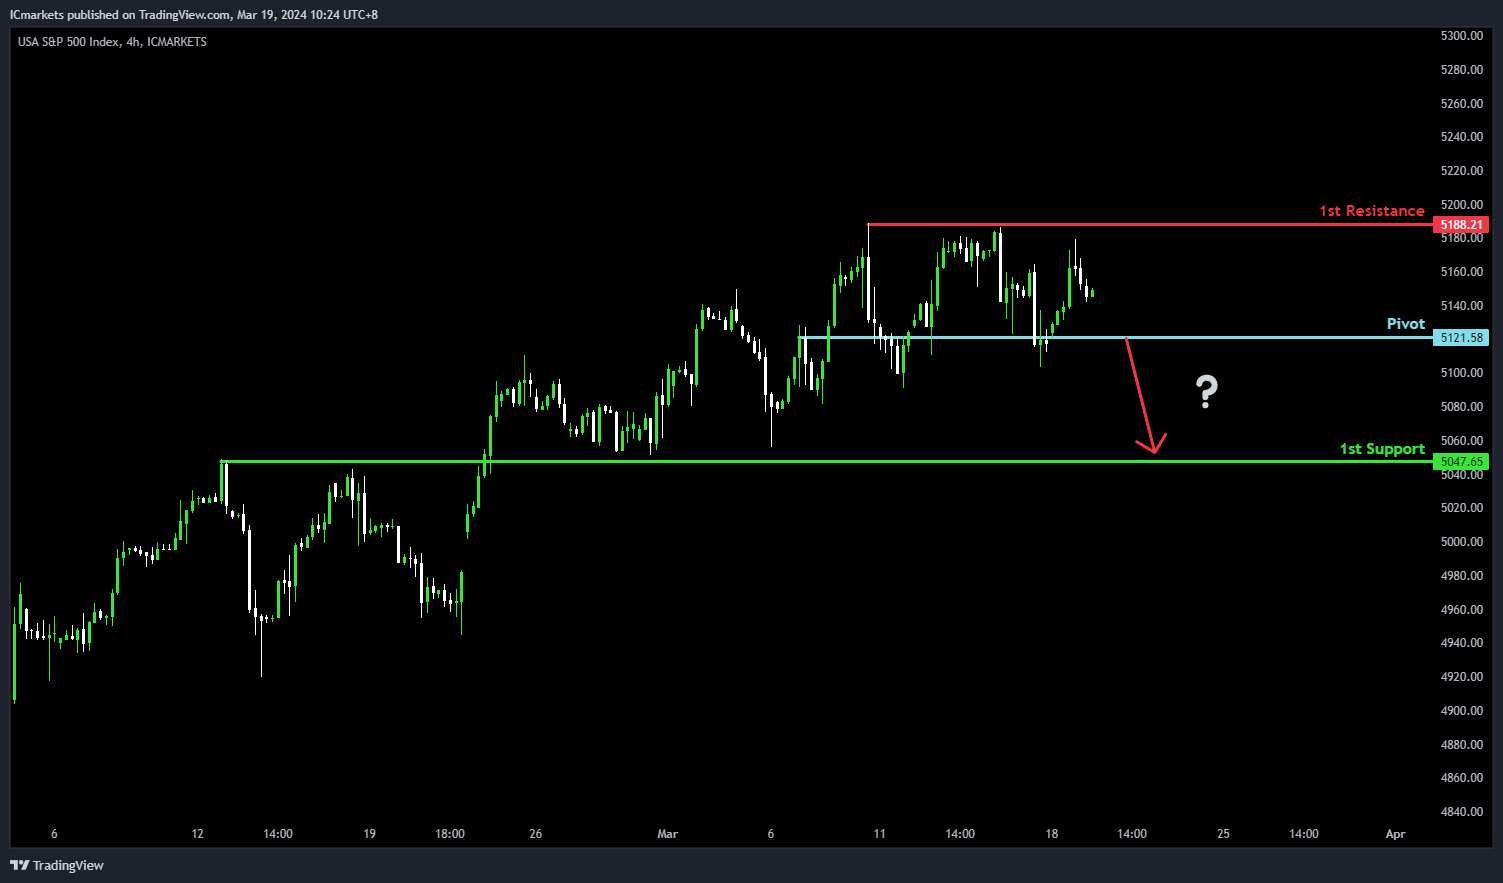
US500:
For US500, despite the bullish overall momentum, there’s a potential bearish scenario.
The price could react bearishly off the pivot at 5121.58, representing an overlap resistance. This level may attract selling interest, potentially leading to a drop towards the 1st support at 5047.65, which serves as an overlap support, historically significant for buyers.
Conversely, the 1st resistance at 5188.21 acts as a multi-swing high resistance, potentially limiting further bullish movement.
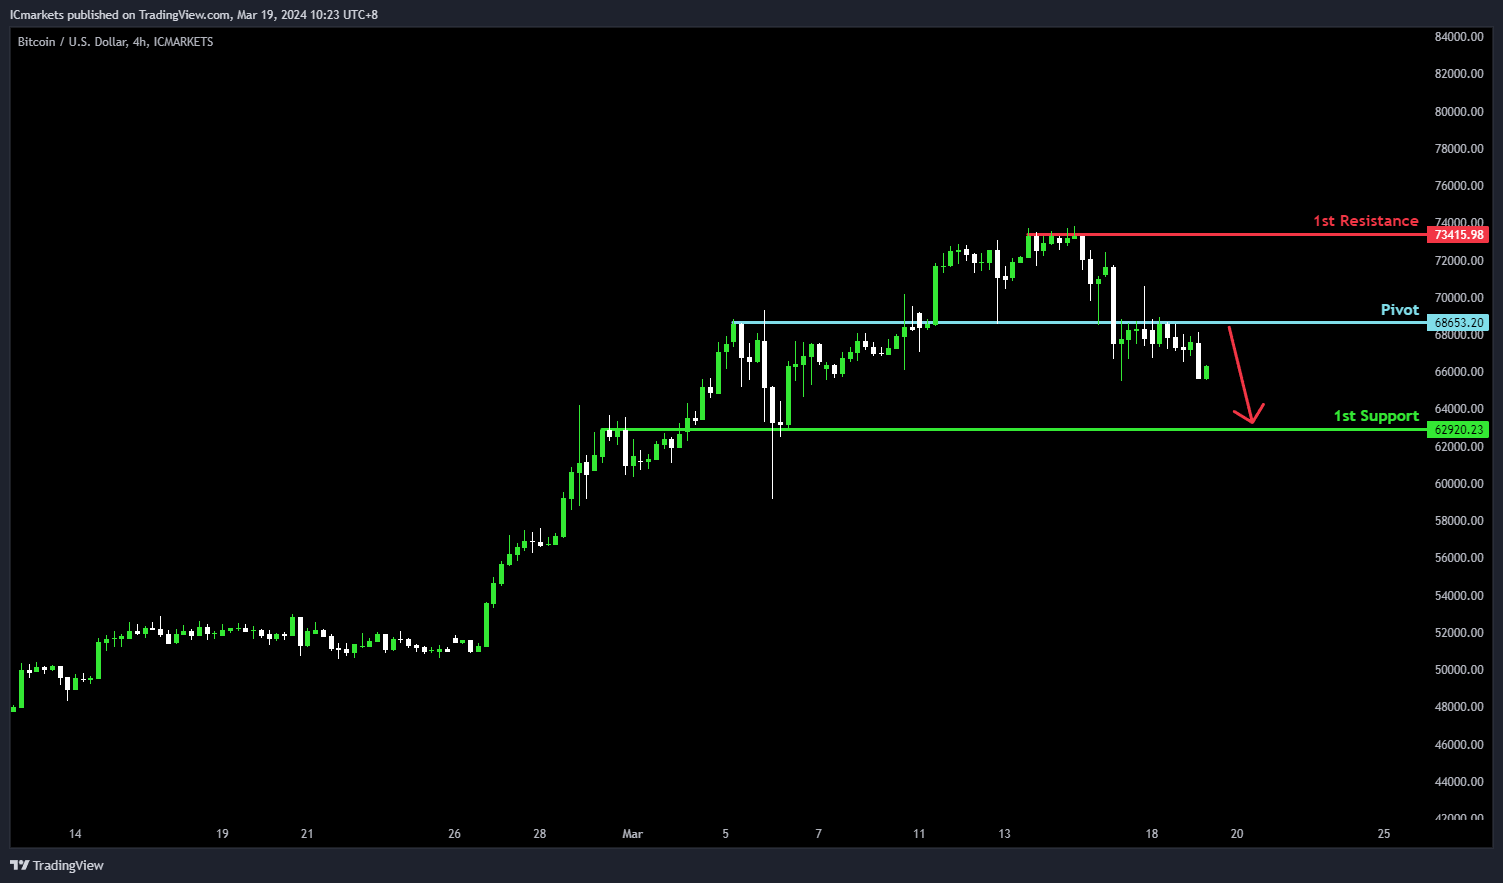
BTC/USD:
The BTC/USD chart currently demonstrates an overall bearish momentum. In this context, there is a potential scenario for price to rise towards the pivot before reversing to drop towards the 1st support.
The pivot level at 68,653.20 is identified as an overlap resistance where price could potentially make a bearish reversal. The 1st support level at 62,920.23 is marked as an overlap support, reinforcing its significance as a key support level.
To the upside, The 1st resistance level at 73,415.98 is noted as a pullback resistance at the all-time high, further reinforcing its significance as a potential barrier to further bullish movement.
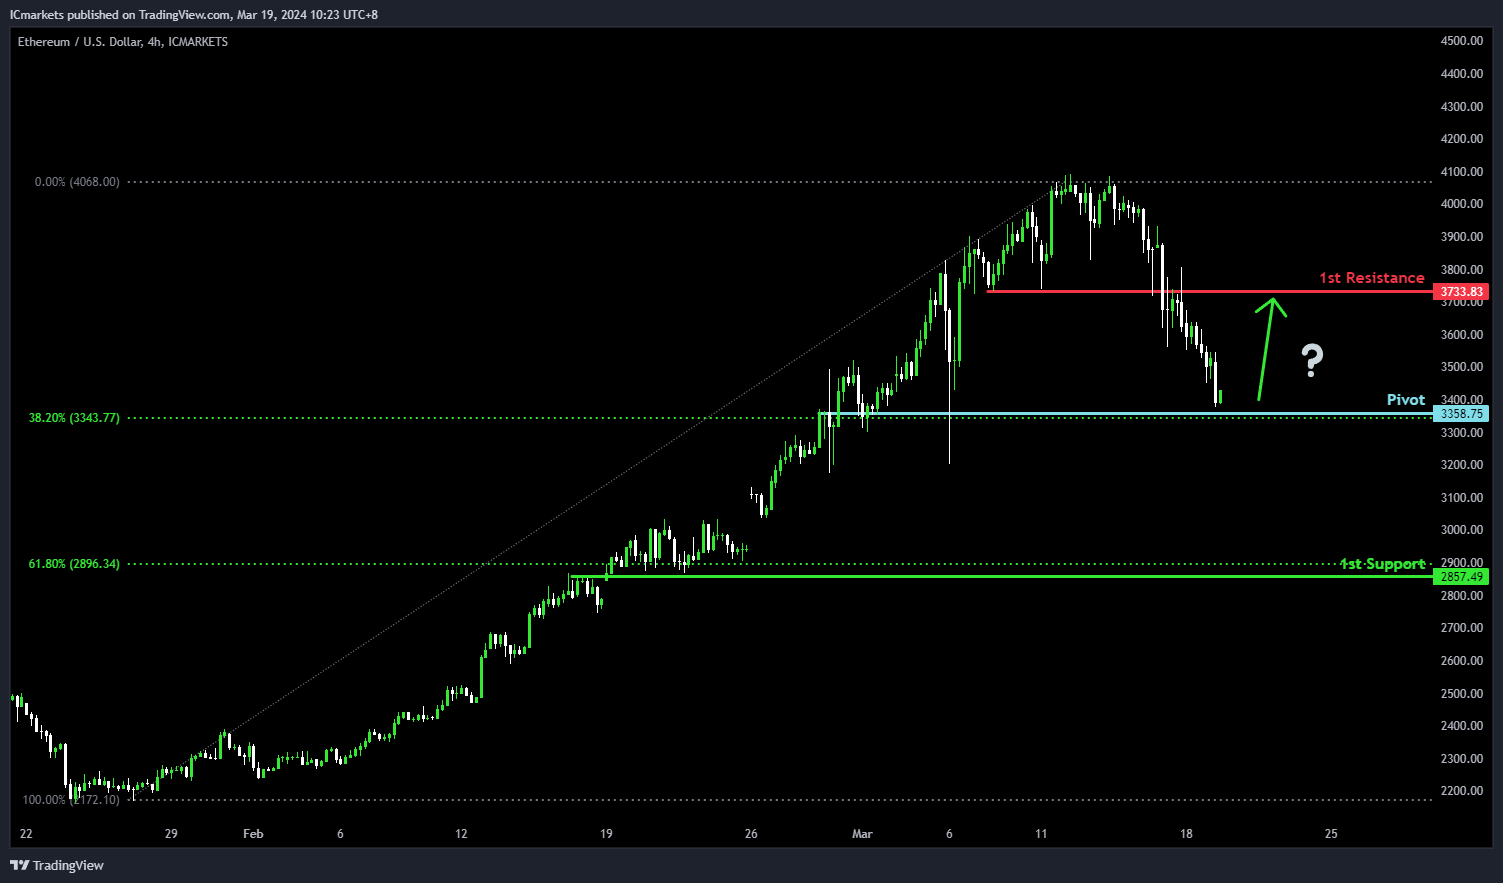
ETH/USD:
The ETH/USD chart currently demonstrates an overall bearish momentum. However, there is a potential scenario for price to bounce off the pivot and rise towards the 1st resistance.
The pivot level at 3,358.75 is identified as an overlap support that aligns with the 38.20% Fibonacci Retracement level where price could potentially make a bullish reversal. The 1st resistance level at 3,733.83 is noted as an overlap resistance, further reinforcing its significance as a potential barrier to further bullish movement.
To the downside, the 1st support level at 2,857.49 is marked as an overlap support that aligns close to the 61.80% Fibonacci Retracement level, reinforcing its significance as a key support level.
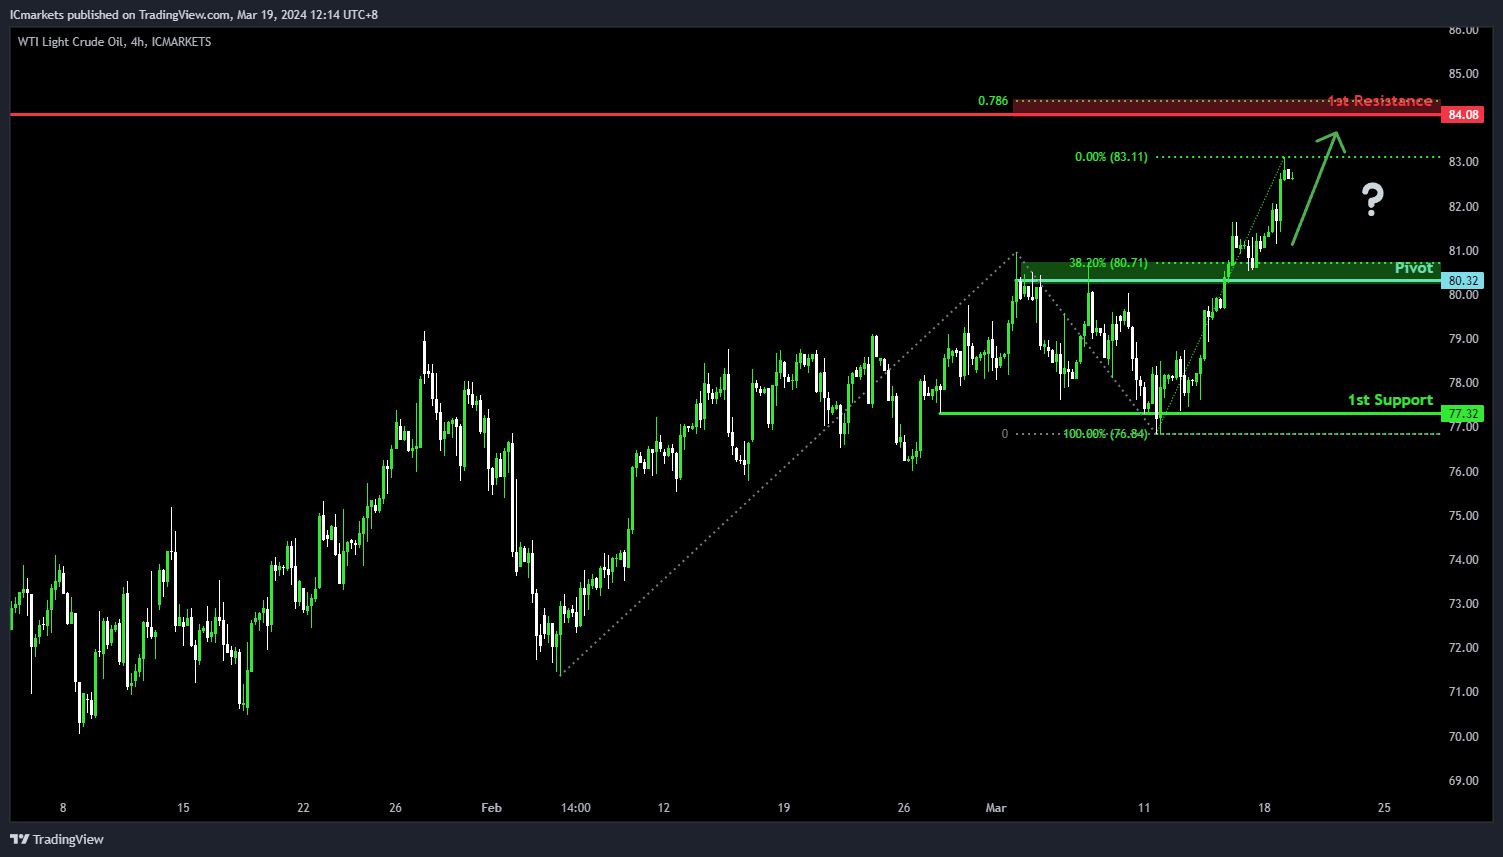
WTI/USD:
The WTI (West Texas Intermediate) chart currently demonstrates an overall bullish momentum. Howere, there is a potential scenario for price to fall towards the pivot before making a bullish bounce and rise towards the 1st resistance.
The pivot level at 80.32 is identified as an overlap support that aligns close to the 38.2% Fibonacci Retracement level where price could potentially make a bullish bounce. The 1st resistance level at 84.08 is noted as an overlap resistance that aligns close to the 78.60% Fibonacci Projection level, further reinforcing its significance as a potential barrier to further bullish movement.
To the downside, the 1st support level at 77.32 is marked as a pullback support, reinforcing its significance as a key support level.
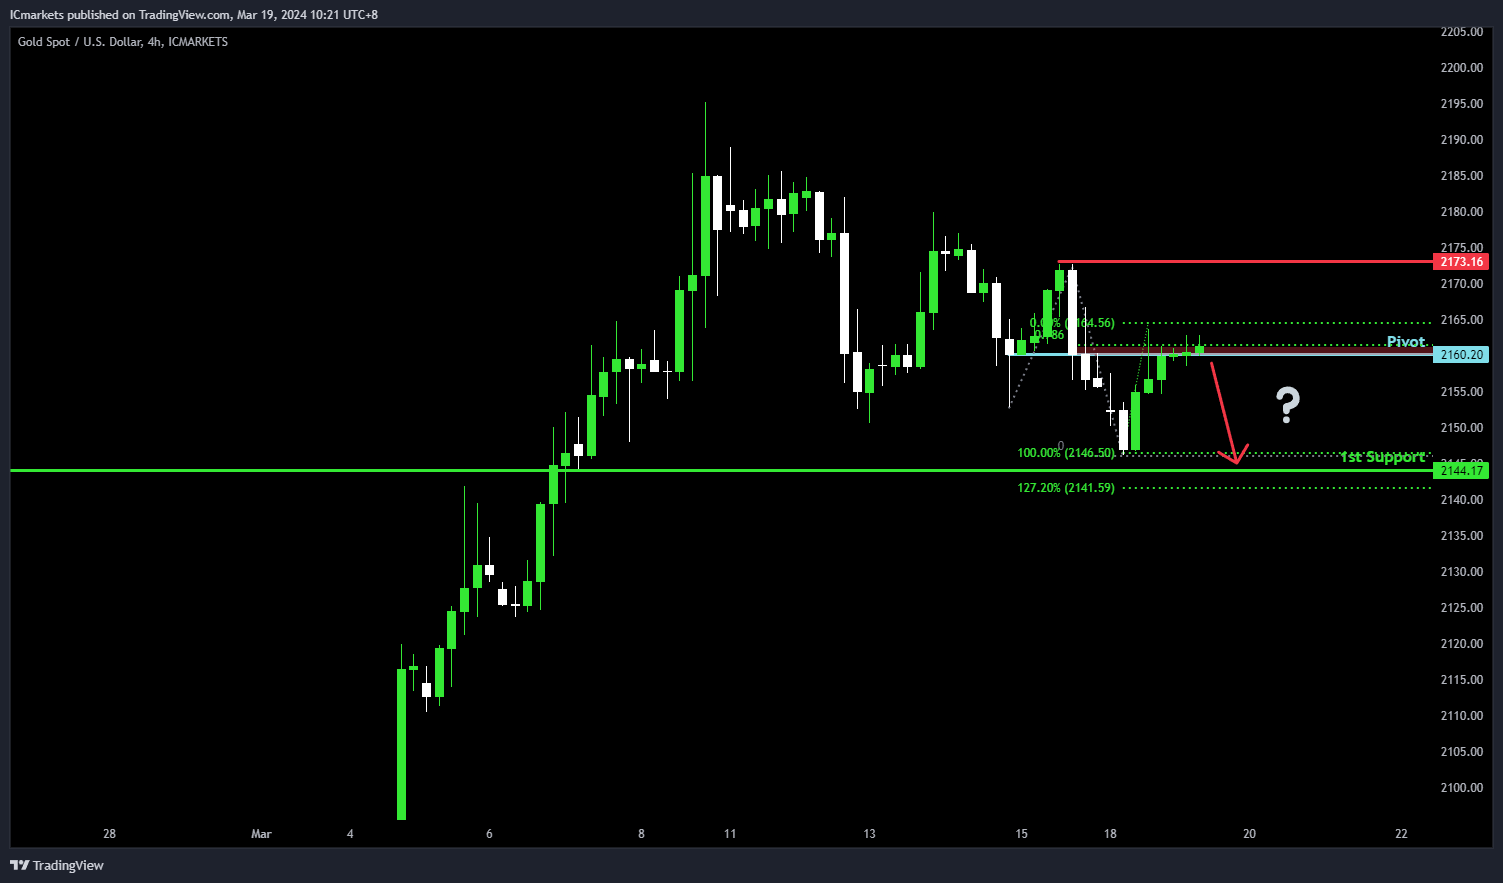
XAU/USD (GOLD):
For XAU/USD, despite the overall bullish momentum of the chart, there’s a potential scenario suggesting a bearish break off the pivot level, potentially leading to a drop towards the 1st support.
The pivot at 2160.20 is a significant level, identified as overlap support, with reinforcement from the 78.60% Fibonacci Projection. This indicates a crucial area where buyers have historically intervened. Additionally, the 1st support at 2144.17 acts as another level of overlap support, further strengthening its significance.
On the resistance side, the 1st resistance at 2173.16 is noted as swing-high resistance, forming a barrier to upward movement, potentially reinforcing the bearish sentiment.
USD/CAD Daily Outlook
Daily Pivots: (S1) 1.3519; (P) 1.3536; (R1) 1.3550; More...
No change in USD/CAD's outlook and intraday bias stays on the upside. Further rise should be seen to retest 1.3605 resistance first. Firm break there will resume whole rally from 1.3176. On the downside, however, break of 1.3458 minor support will turn bias back to the downside or 1.3419 instead.
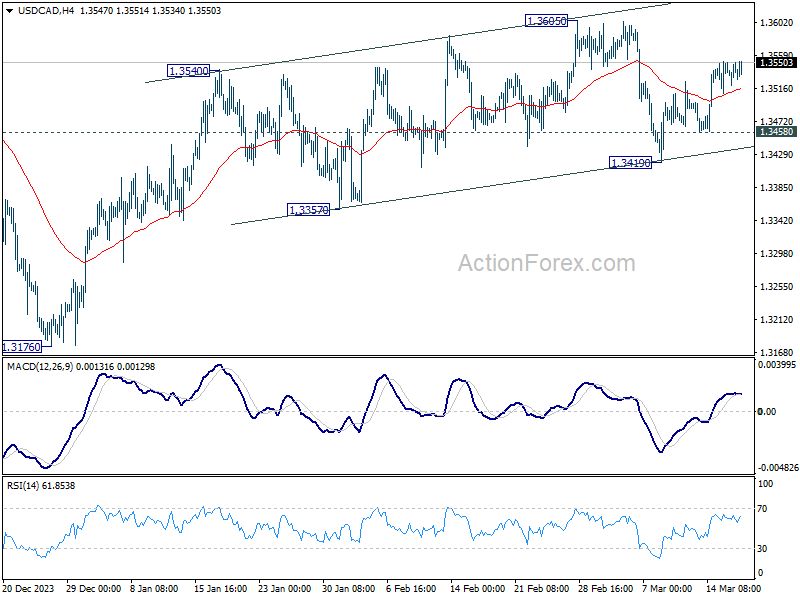
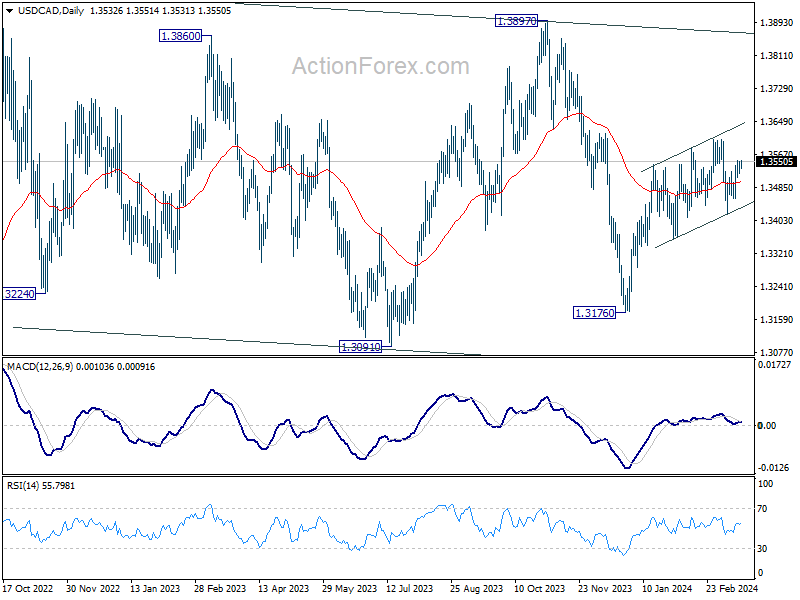
In the bigger picture, price actions from 1.3976 (2022 high) are viewed as a corrective pattern only. In case of another fall, strong support should emerge above 1.2947 resistance turned support to bring rebound. Overall, larger up trend from 1.2005 (2021 low) is still expected to resume through 1.3976 at a later stage.
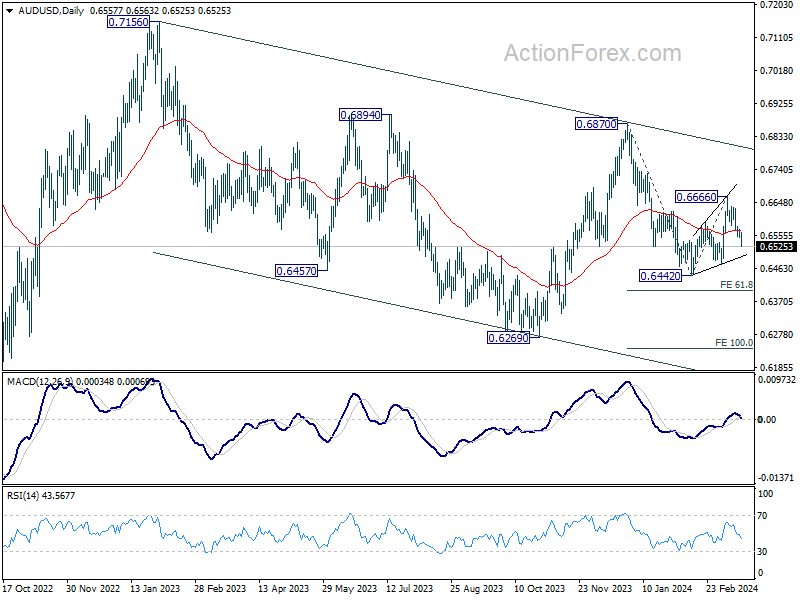
AUD/USD Daily Report
Daily Pivots: (S1) 0.6549; (P) 0.6562; (R1) 0.6572; More...
AUD/USD's fall from 0.6666 is in progress and intraday bias stays on the downside for 0.6476 support. Break there will argue that decline from 0.6870 is ready to resume through 0.6442 low. On the upside, break of 0.6583 minor resistance will turn intraday bias neutral first. But risk will stay on the downside as long as 0.6666 resistance holds.
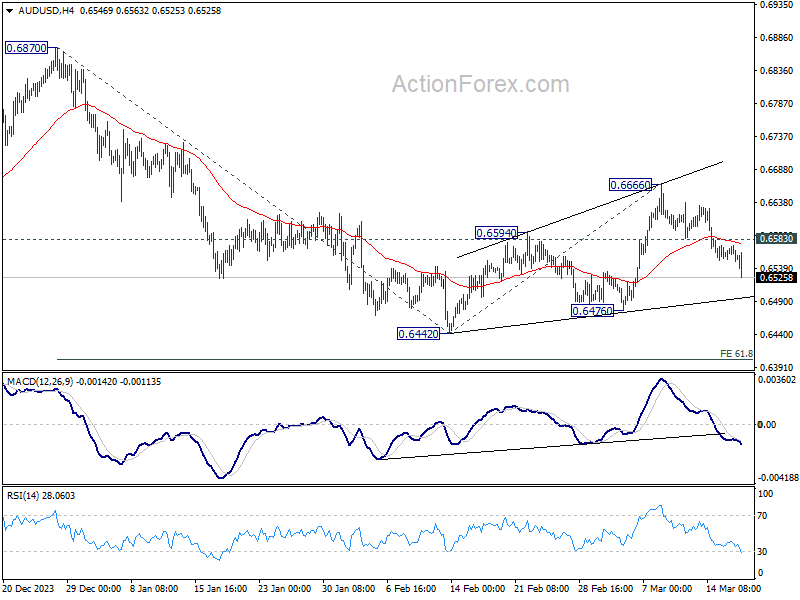
In the bigger picture, price actions from 0.6169 (2022 low) are seen as a medium term corrective pattern to the down trend from 0.8006 (2021 high). Fall from 0.7156 (2023 high) is seen as the second leg, which might still be in progress. Overall, sideway trading could continue in range of 0.6169/7156 for some more time. But as long as 0.7156 holds, an eventual downside breakout would be mildly in favor.