

Sample Category Title
USD Slips, Gold Soars
The USD tended to weaken against a number of its counterparts yesterday as BoE and ECB adopted a more hawkish tone in their respective interest rate decision, altering the interest rate outlook differentials. It should be noted that US yields also seemed to slip weakening the USD, which on the other hand provided tailwinds for gold’s price to fly and the precious metal seems about to end its best week since mid-November.
Also, analysts tend to note that inflationary pressures in the US economy may still outweigh the Fed’s stance despite the bank performing a hawkish pivot forecasting three rate hikes in 2022. Also, financial releases yesterday from the US tended to disappoint traders given that various indicators seem to point towards a slowdown in the expansion of economic activity in the US. Today given the lack of high impact financial releases from the US, we expect fundamentals to take over and we note the planned speeches of San Francisco Fed President Daly and Fed Reserve Board Governor Waller, while EUR traders may be more interested in Germany’s Ifo indicators for December.
XAU/USD was on the rise yesterday breaking the 1793 (S1) resistance line now turned to support. We tend to maintain a bullish outlook for the precious metal given also the bullish sentiment as the RSI indicator below our 4-hour chart is at the reading of 70, which could also be implying that he pair is near overbought levels and ripe for a correction lower. Should the precious metal continue to be guided by buyers, we may see its price breaking the 1815 (R1) resistance line and open the way for the 1830 (R2) level. Should a selling interest be displayed for gold we may see its price reversing course breaking the 1793 (S1) support line and aim for the 1770 (S2) support level
BoE’s hike supporting the pound
The pound found some support yesterday, strengthening against the USD but also JPY, as BoE proceeded with a 15-basis points rate hike. Despite the Omicron variant still posing a threat for the recovery of the UK economy, the rate hike still seems to be making sense given the strong inflationary pressures in the UK economy as well as the tightening of the UK employment market . So, in the big picture BoE’s monetary policy seems to remain supportive for the pound as the bank seems to be tightening it. On the fundamental level, besides the path of the pandemic in the UK we also note that over the weekend, UK and EU officials meet online to discuss impasse over Northern Ireland’s trading arrangements and should the disagreements resurface we may see the pound weakening.
We still see the political situation of the UK government as being shaky due to the scandals, a recent rebellion of Torrie lawmakers and the loss of a parliamentary seat in an election that was considered key, yesterday. As for financial releases we may see pound traders focusing on the release of the UK retail sales growth rate for November.
GBP/USD rose yesterday rose breaking the 1.3280 (S1) resistance line, now turned to support. Despite the stabilisation the RSI indicator below our 4 hour chart is between the readings of 50 and 70 implying that the bulls may have an advantage. Should more buying orders be placed for cable we may see the pair breaking the 1.3430 (R1) resistance line and aim for the 1.3600 (R2) level. Should a selling interest be displayed by the market we may see the pair breaking the 1.3280 (S1) line and aim for the 1.3160 (S2) support level.
Other highlights for today
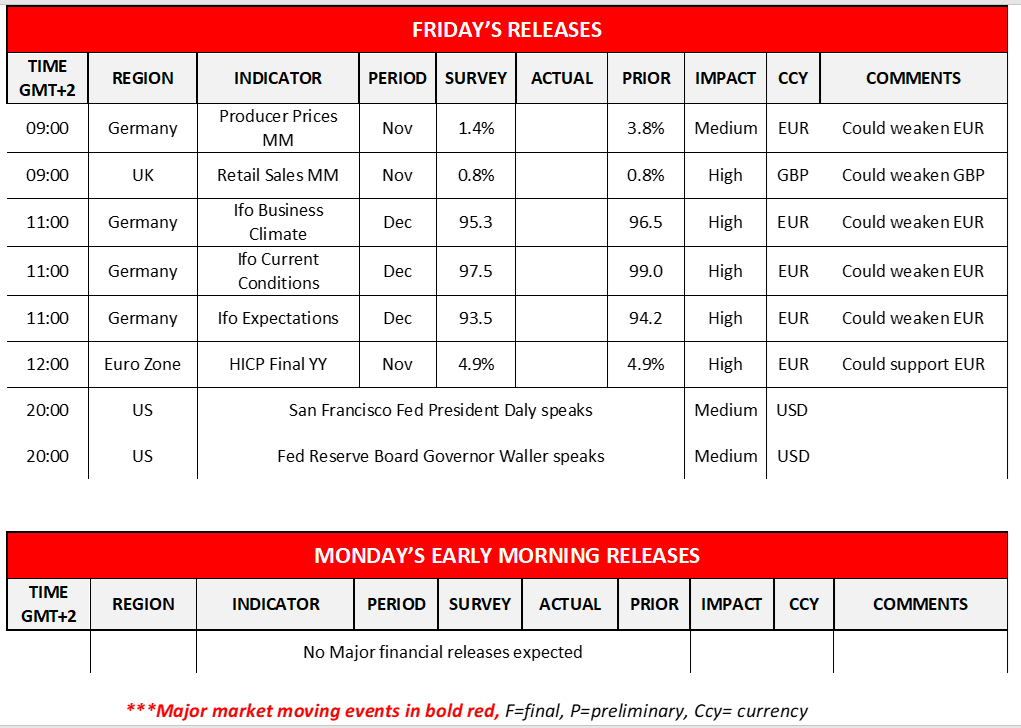
Today we note the release of Germany’s PPI rates for November, Ifo’s indicators for December and Eurozone’s final HICP rate for November, while from the UK we get the retail sales growth rate for November. In the American session, we note the planned speeches of San Francisco Fed President Daly and Fed Reserve Board Governor Waller.
XAU/USD H4 Chart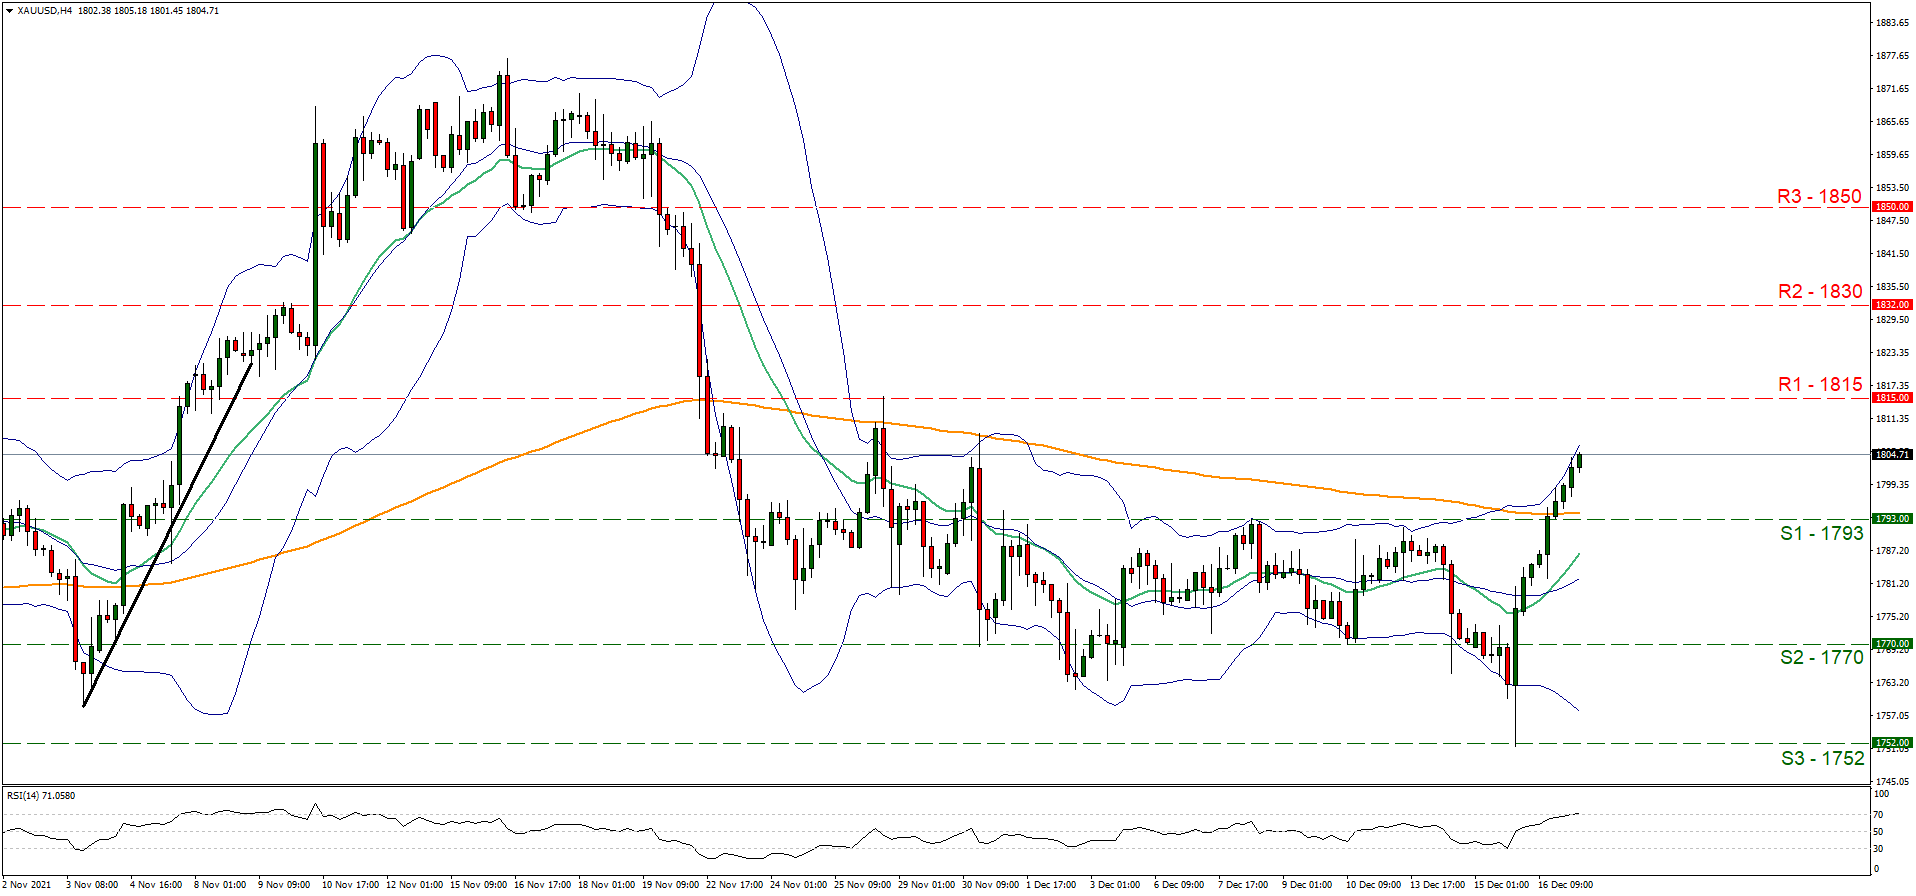
Support: 1793 (S1), 1770 (S2), 1752 (S3)
Resistance: 1815 (R1), 1830 (R2), 1850 (R3)
GBP/USD H4 Chart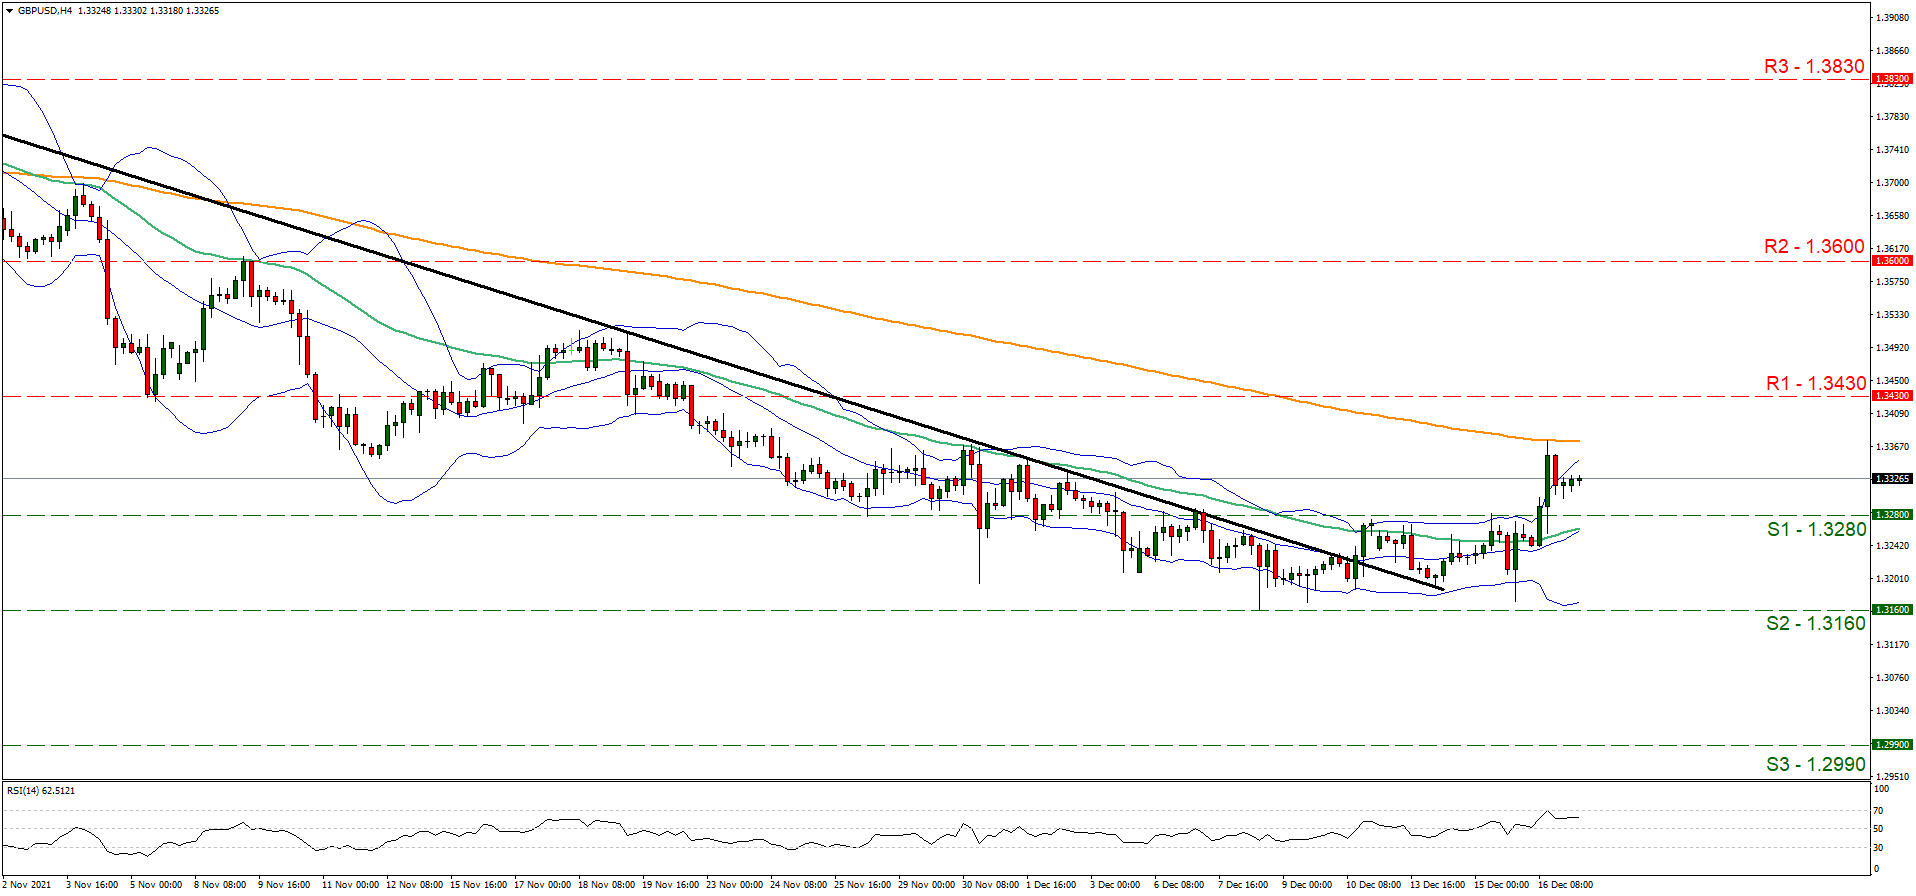
Support: 1.3280 (S1), 1.3160 (S2), 1.2990 (S3)
Resistance: 1.3430 (R1), 1.3600 (R2), 1.3830 (R3)
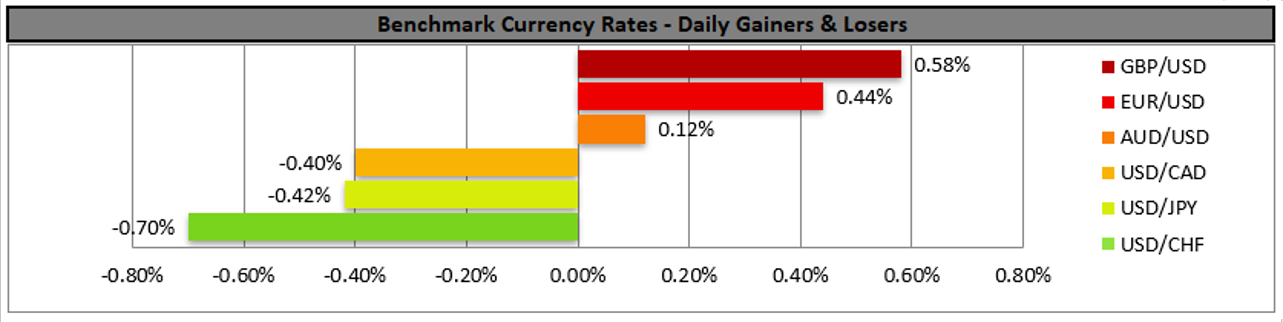
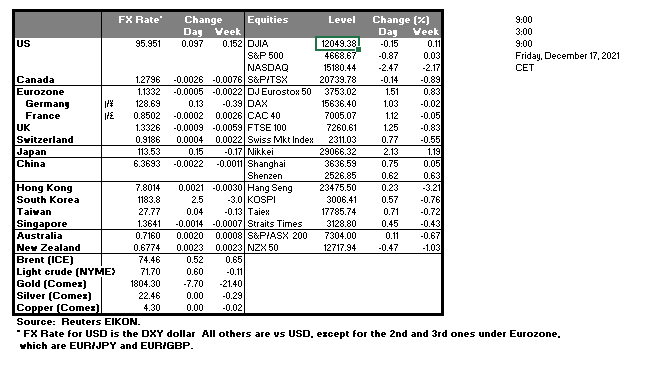
USD/CAD Trades Sideways
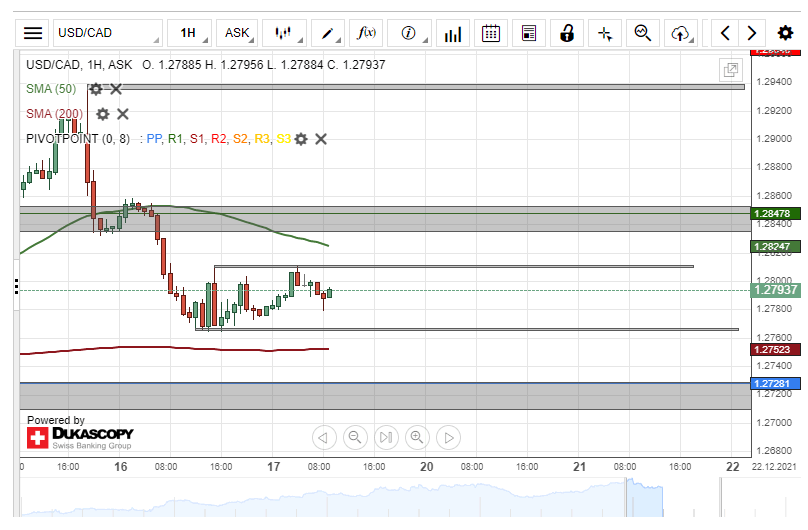
The decline of the USD/CAD appears to have ended, as the rate has been trading sideways in a set range since the middle of Thursday's trading hours. Namely, the pair is trading between the support of the 1.2765 level and the resistance of the 1.2810 mark.
If the currency exchange rate passes the resistance of the 1.2810 level, the rate could find resistance in the 50-hour simple moving average near 1.2825.
Meanwhile, a decline of the USD against the CAD could find support in the 200-hour SMA at 1.2750, before reaching the support zone at 1.2710/1.2728.
GBP/JPY Breaks Pattern And Books New High
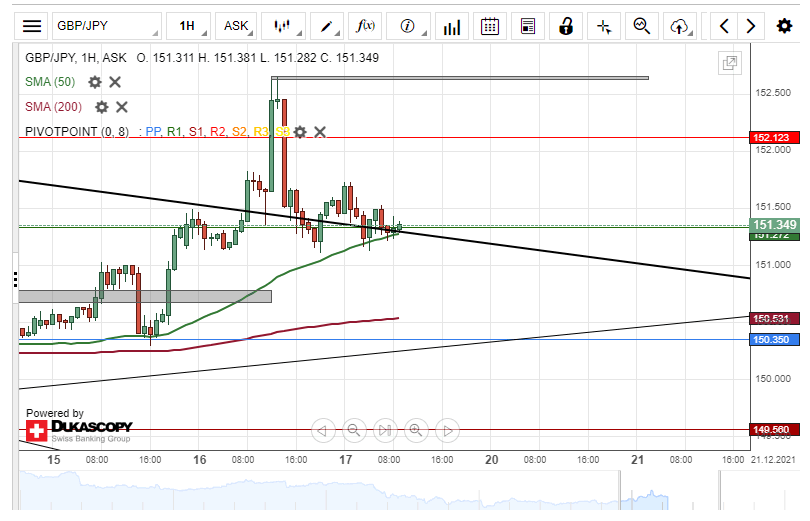
The Bank of England unexpectedly hiked interest rates on Thursday at 12:00 GMT. However, prior to the hike and surge that was caused by it, the rate broke the upper trend line of the channel down pattern, which has guided the rate since late October. Afterwards, anew December high level was booked at 152.65
On Friday morning, the rate was finding support in the 50-hour simple moving average near the 151.25 level. Meanwhile, the rate was ignoring the weekly R1 simple pivot point at 151.33.
If the simple moving average pushes the pair up, it could cone again reach the 152.65 level. However, to reach the high level, the pair would have to pass the resistance of the 152.00 mark, the weekly R2 simple pivot point and the 152.50 level.
On the other hand, a failure of the SMA might result in a decline to the 151.00 mark. Below the 151.00 level, the 200-hour SMA is strengthening the 150.50 level's support. Meanwhile, take into account the weekly simple pivot point at 150.35 and the trend line, which connects December low levels.
AUD/USD Declines From New High
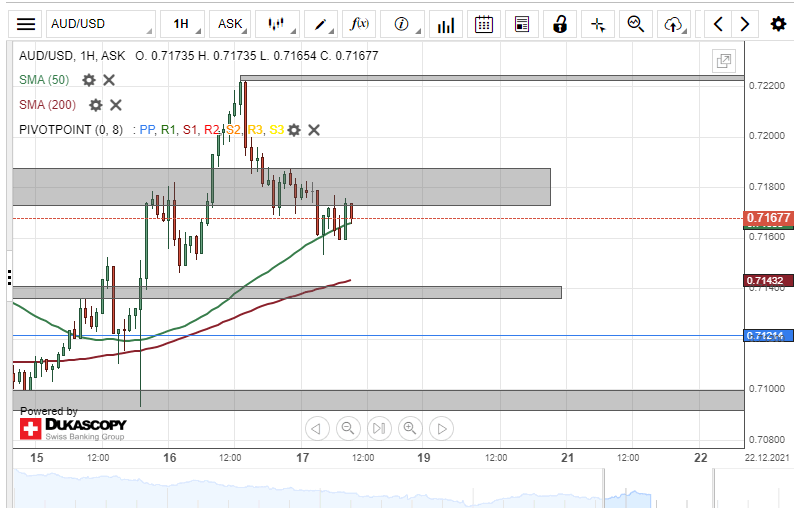
On Thursday, the AUD/USD currency pair booked a new December high level at 0.7224. The rate bounced off this level and started a decline. By the start of Friday's European trading hours, the rate had reached the 0.7160 level. During the decline, the pair had passed a support zone that surrounds the 0.7180 mark and the 50-hour simple moving average.
A continuation of the decline of the Aussie against the USD might look for support in the 200-hour simple moving average near 0.7140 and the zone at 0.7136/0.7142. Below these levels, the weekly simple pivot point at 0.7121 might act as support.
However, a recovery of the rate would have to pass the 0.7173/0.7188 zone, before aiming at the December high level at 0.7224.
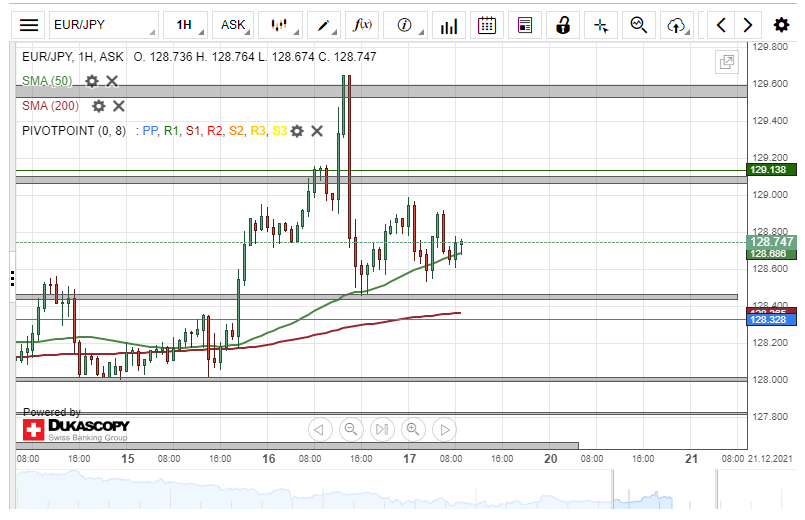
EUR/JPY Reacts To ECB Statement
The EUR/JPY currency exchange rate was surging on Thursday, as it reached above the 129.60 mark during the second half of the day's trading. However, at 13:30 GMT, the European Central Bank press conference started, during which information was revealed that beat down the value of the Euro. By 16:00 GMT, the rate had reached the 128.45 level, where it found support in a combination of the 50-hour SMA and a prior high level zone.
On Friday morning, the rate had recovered and tested the resistance of the 129.00 mark. Meanwhile, it was expected that support would still be provided at 128.45.
In the case that the rate continues to recover, it would have to pass levels that provided resistance previously. Namely, take into account the 129.00 mark, the high level zone above 129.00 and the weekly R1 simple pivot point at 129.14. Higher above, the rate could encounter resistance at the 129.53/129.60 zone.
On the other hand, a decline of the Euro against the Japanese Yen would once again look for support the 128.45 level. Below the 128.45 mark, support is provided by the 200-hour simple moving average near 128.35 and the weekly simple pivot point at 128.33. Further, the 128.00 level is expected to stop a decline.
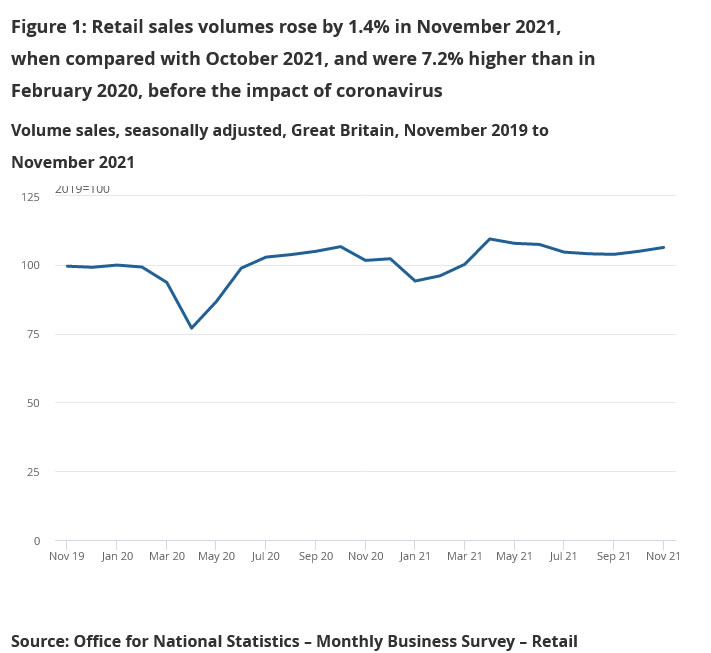
UK retail sales rose 1.4% mom in Nov, ex-fuel sales rose 1.1% mom
UK retail sales rose 1.4% mom in November, above expectation of 0.8% mom. Sales were 7.2% higher than their pre-coronavirus February 2020 levels. Ex-automotive fuel sales rose 1.1% mom. For the 12 month period, headline sales rose 4.7% yoy while ex-automotive fuel sales rose 2.7% yoy.
Over the three months to November 2021, however, sales fell by -0.6% when compared with the previous three months.
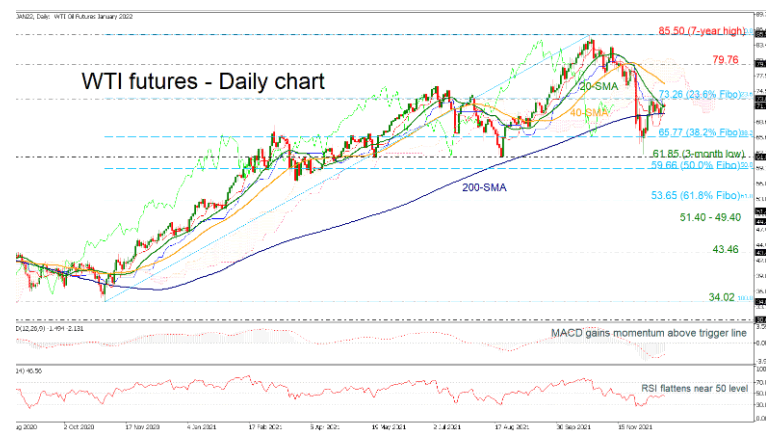
WTI Futures Struggles Around 23.6% Fibonacci, 200-Day SMA Holds
WTI futures are facing some difficulty to surpass the 23.6% Fibonacci retracement level of the up leg from 34.02 to 85.50 at 73.26 and are moving sideways around the 20-day simple moving averages (SMAs) in the short-term.
Technically, the MACD oscillator is rising above its trigger line in the negative region, while the RSI is flattening around the 50 level.
If the pair jumps above the 23.6% Fibonacci of 73.26 ahead of the lower boundary of the Ichimoku cloud which overlaps with the 40-day SMA at 75.75, it could touch the 79.76 resistance. Moving higher the seven-year high of 85.50 may halt the bullish actions
On the flip side, a drop below the 200-day SMA may open the door for the 38.2% Fibonacci of 65.77 and then for the latest three-month low of 61.85. Slightly lower, the bears may meet the 50.0% Fibonacci of 59.66 and the 61.8% Fibonacci of 53.65.
All in all, the oil may return to bullish actions if there is a penetration of the 23.6% Fibonacci of 73.26 and the 40-day SMA. Though, a slip below the three-month low may switch the outlook to bearish.
GBP/JPY Daily Outlook
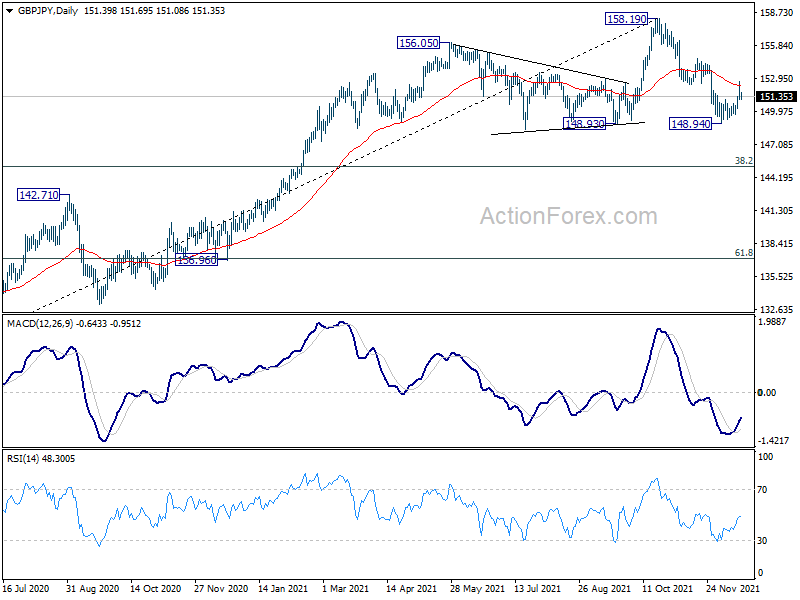
Daily Pivots: (S1) 150.84; (P) 151.74; (R1) 152.38; More...
Intraday bias in GBP/JPY is turned neutral as it retreated after hitting 152.60. On the upside, break of 152.60 will solidify the case that correction from 158.19 has completed with three waves down to 148.94, after defending 148.93 key structural support. Further rally would be seen to 154.70 resistance for confirmation.
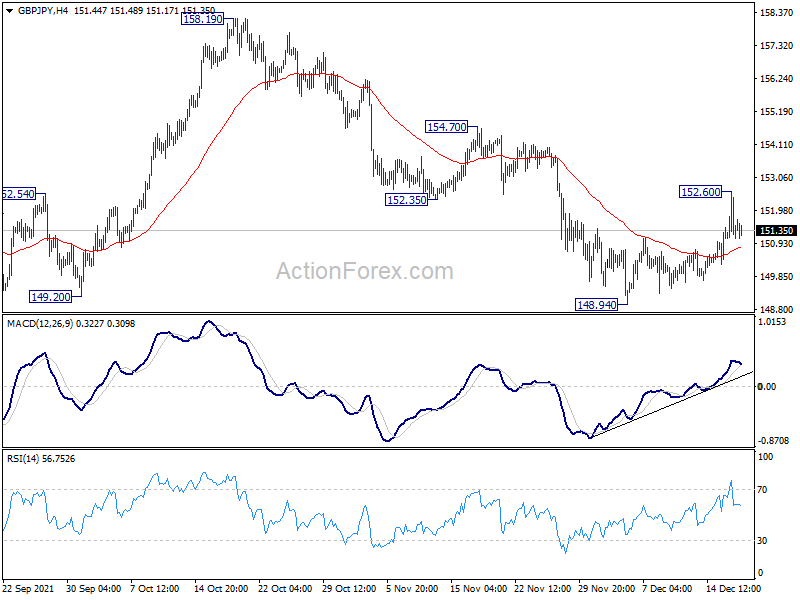
In the bigger picture, strong rebound from 148.93 key structural support will retain medium term bullishness. Firm break of 158.19 high will resume whole up trend from 123.94 (2020 low). Nevertheless, firm break of 148.93 will bring deeper correction to 38.2% retracement of 123.94 to 158.19 at 145.10, and possibly further lower.
EUR/JPY Daily Outlook
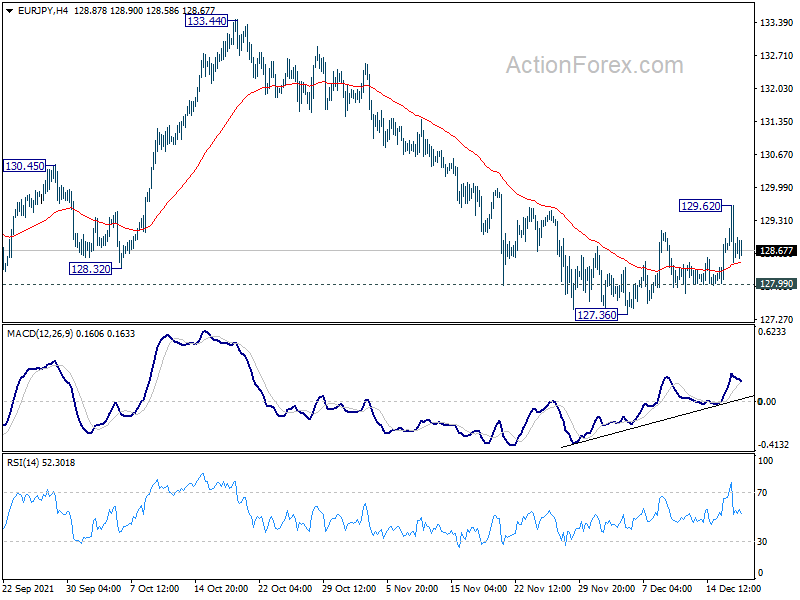
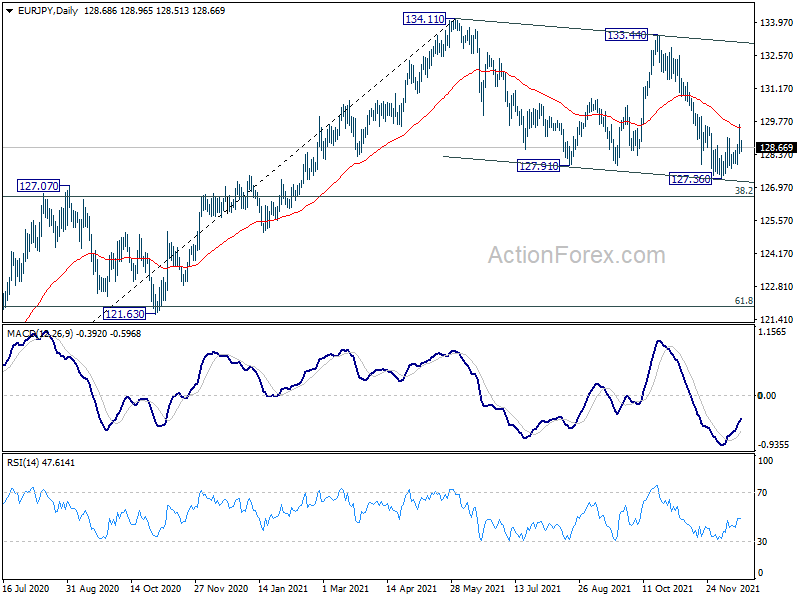
Daily Pivots: (S1) 128.31; (P) 128.98; (R1) 129.49; More....
Intraday bias in EUR/JPY is turned neutral again as it retreated deeply after rising to 129.62. On the upside, sustained trading above 55 day EMA (now at 129.49) will affirm the case that corrective pattern from1 34.11 has completed. Further rise should be seen back to 133.44/134.11 resistance zone. On the downside, break of 127.99 minor support will resume fall from 133.44 through 127.36 to 126.58 medium term fibonacci level.
In the bigger picture, as long as 38.2% retracement of 114.42 (2020 low) to 134.11 at 126.58 holds, up trend from 114.42 is still in favor to continue. Break of 134.11 will target long term resistance at 137.49 (2018 high). However, sustained break of 126.58 will raise the chance of medium term bearish reversal. In this case, deeper decline would be seen to 61.8% retracement at 121.94, and possibly below.
NZD/USD Breaks Resistance
The New Zealand dollar rallied as risk sentiment made its return post-FOMC.
A bullish RSI divergence indicates a deceleration in the sell-off momentum. The long candle wick from 0.6700 suggests solid buying interest. Then a break above 0.6800 has put the last sellers under pressure.
An overbought RSI has limited the initial surge. A pullback may test 0.6755, previously a resistance that has turned into a support. 0.6860 near the 30-day moving average is the next hurdle, and its breach could trigger a bullish reversal.
