Sample Category Title
NZ First Impressions: GDP, March Quarter 2024
The New Zealand economy grew by 0.2% in the March quarter, beating our forecast of a modest decline. However, the details don’t change our view of the underlying strength of activity.
Key results
- Quarterly change: +0.2% (last: -0.1%, Westpac f/c: -0.2%, market f/c: +0.1%, RBNZ +0.2%)
- Annual change: +0.3% (Last -0.3%, Westpac f/c -0.2%, RBNZ +0.3%)
The New Zealand economy skirted another decline in the March quarter, with GDP rising by 0.2%. That was broadly in line with what the market and the Reserve Bank were expecting, though it beat our bottom-of-the-range forecast of a 0.2% decline.
The details were mixed in much the way that we expected them to be – half of the 16 industries saw gains of varying degrees, while the other half saw declines. The strongest gains were in electricity (due to a higher share of cheaper hydro generation during the quarter), food manufacturing (reflecting increased milk production and a rebound in drinks) and forestry. There were declines in non-food manufacturing, construction, and professional services.
For our part, the forecast miss wasn’t very illuminating. Much of it came from the ‘unallocated’ category, which alone contributed 0.3 percentage points to GDP growth over the quarter. This group includes items such as duties on imports, which saw an unusually large rise over the quarter.
Given the ongoing strength in migration-led population growth, GDP was still down by 0.3% in per-capita terms. Indeed, this was the sixth straight quarterly decline on this measure.
Overall, there is little in today’s report to alter our view of the state of the economy (the forecasts in our May Economic Overview were prepared on the basis of a 0.1% rise in GDP for this quarter, before it was revised down). We expect growth to remain minimal over the course of this year, and indeed recent indicators suggest that the June quarter is shaping up to be quite soft.
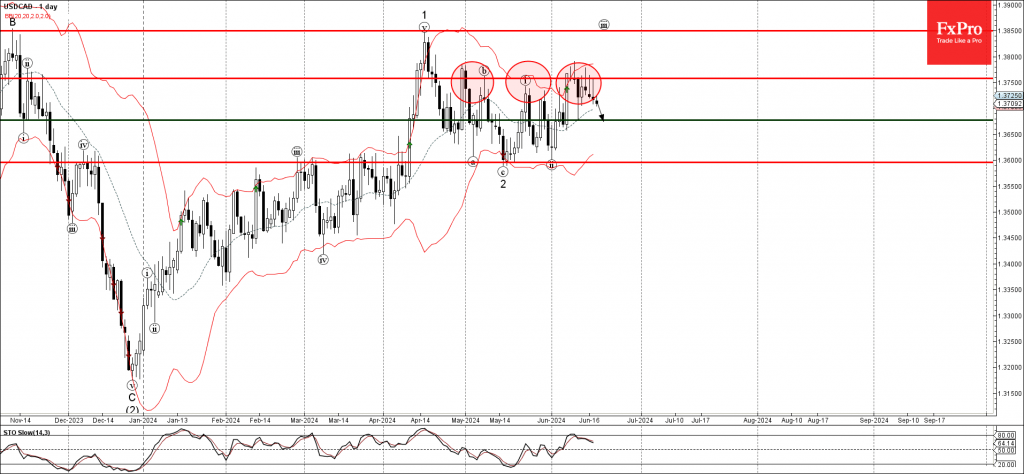
USDCAD Wave Analysis
- USDCAD reversed from pivotal resistance level 1.3760
- Likely to fall to support level 1.3675
USDCAD currency pair under the bearish pressure after the price reversed down 3 times in a row from the pivotal resistance level 1.3760 (which has been reversing the price from the end of April).
Each of the last 3 downward reversals form the resistance level 1.3760 created the daily Japanese candlesticks reversal patterns Hammer.
Given the strength of the resistance level 1.3760, USDCAD currency pair can be expected to fall further to the next support level 1.3675.
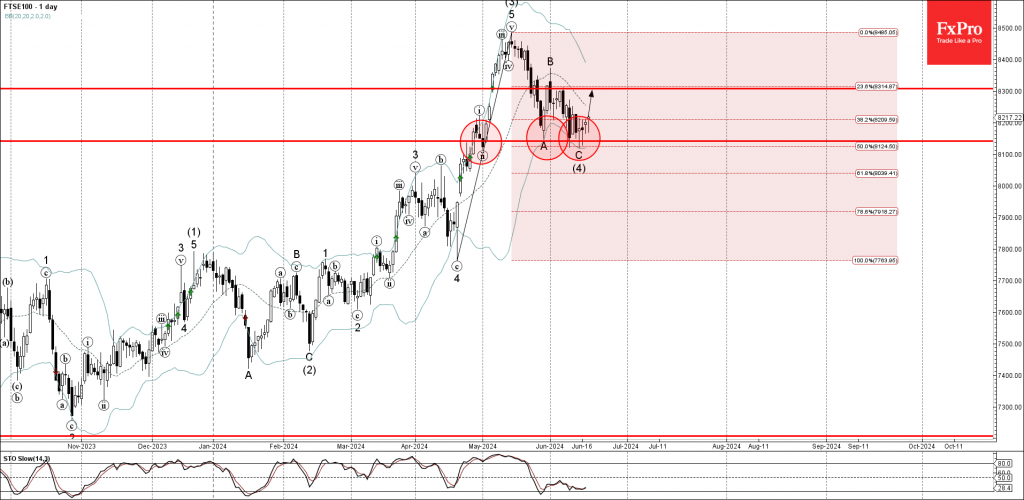
FTSE 100 index Wave Analysis
- FTSE 100 index reversed from support level 8140.00
- Likely to rise to resistance level 8300.00
FTSE 100 index recently reversed up from the key support level 8140.00 (which has been reversing the price from the end of April), intersecting with the lower daily Bollinger Band.
The upward reversal from the support level 8140.00 completed the previous intermediate ABC correction (4).
Given the strength of the support level 8140.00, FTSE 100 index can be expected to rise further to the next resistance level 8300.00, which stopped the price at the start of June.
CHF: Getting Bid Up Due to Safe Haven Status
- The prior 6-month weakness of the Swiss franc against G-10 currencies has seen a short-term bullish reversal due to safe haven demand.
- Ongoing political uncertainty arising from the upcoming French legislative elections reinforced the ongoing CHF strength which led to three consecutive weekly losses on the EUR/CHF cross pair.
- A surprise dovish stance from the SNB monetary policy decision out on Thursday, 20 June may put a short-term halt to the ongoing CHF strength.
- EUR/CHF short-term downtrend remains intact ahead of SNB, watch the 0.9610 key short-term resistance.
During the first quarter of 2024, the Swiss franc has tumbled against most of the G-10 currencies, especially against the US dollar where it underperformed the worst with a current year-to-date intraday loss of 7.3% printed on 27 March.
The CHF’s prior underperformance was due to the dovish stance adopted by the Swiss central bank, SNB which was the first mover among the major developed nations’ central banks to end its interest rate hike cycle on 18 March and enacted its first interest rate cut of 25 basis points (bps) in nine years on its policy rate to bring it down to 1.5%.
CHF’s earlier weakness has reversed to the upside
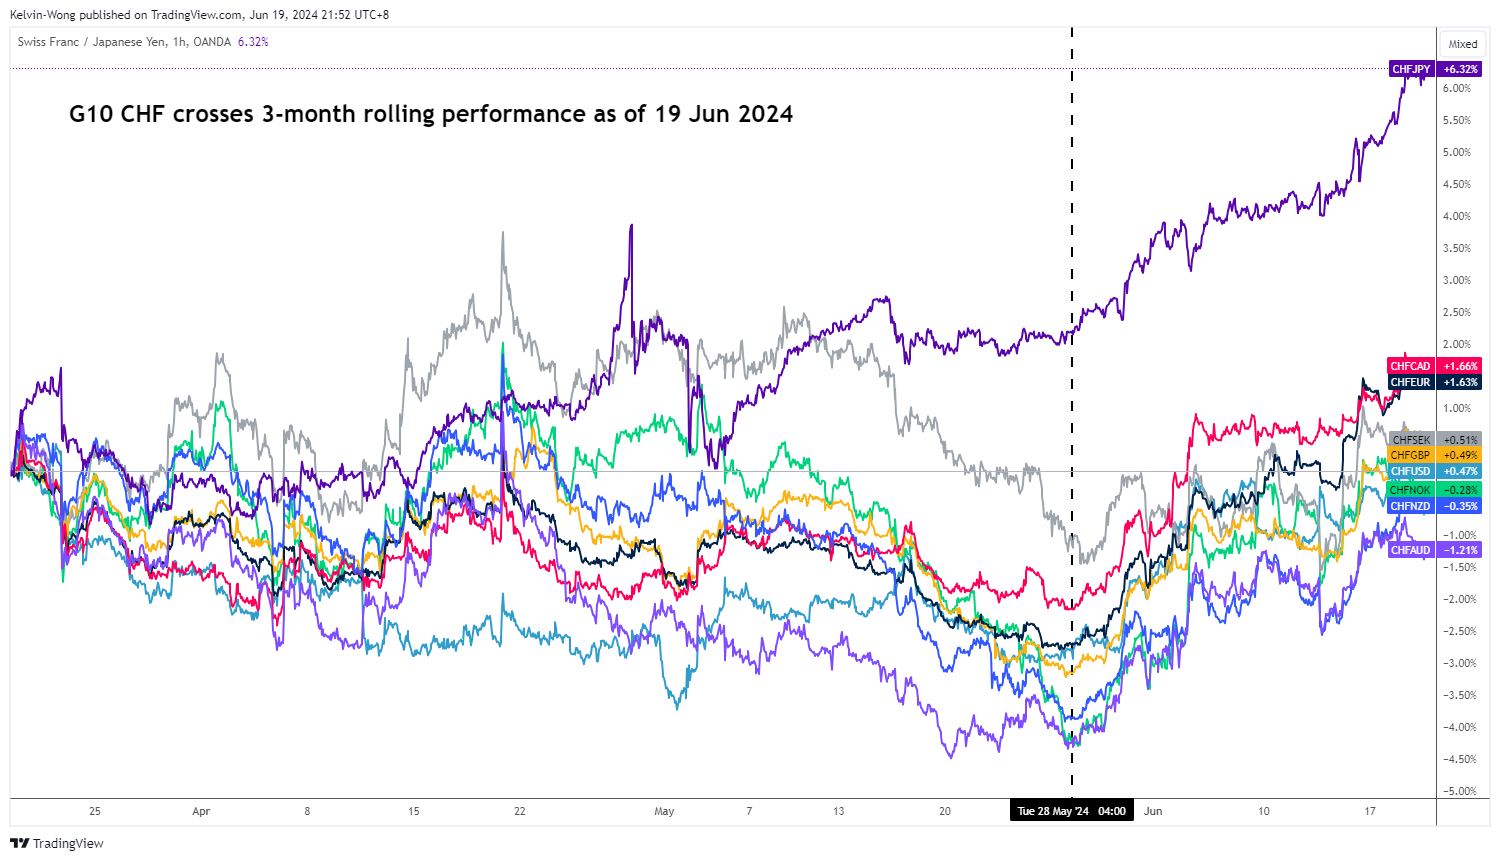
Fig 1: 3-month rolling performances of G-10 CHF crosses as of 19 Jun 2024 (Source: TradingView, click to enlarge chart)
The fortunes of the earlier battered-down Swiss franc started to reverse in late May and further gained strength against the Euro since early June (based on a 3-month rolling basis, the CHF has gained 1.6% against the Euro, see Fig 1) due to political uncertainty in France, a key anchor economy within the European Union where Le Pen’s right-wing party is gaining a significant foothold over French President Macron’s centrist party in the upcoming French legislation election, first round of voting on 30 June.
Increasing credit risk factor in France’s sovereign bonds
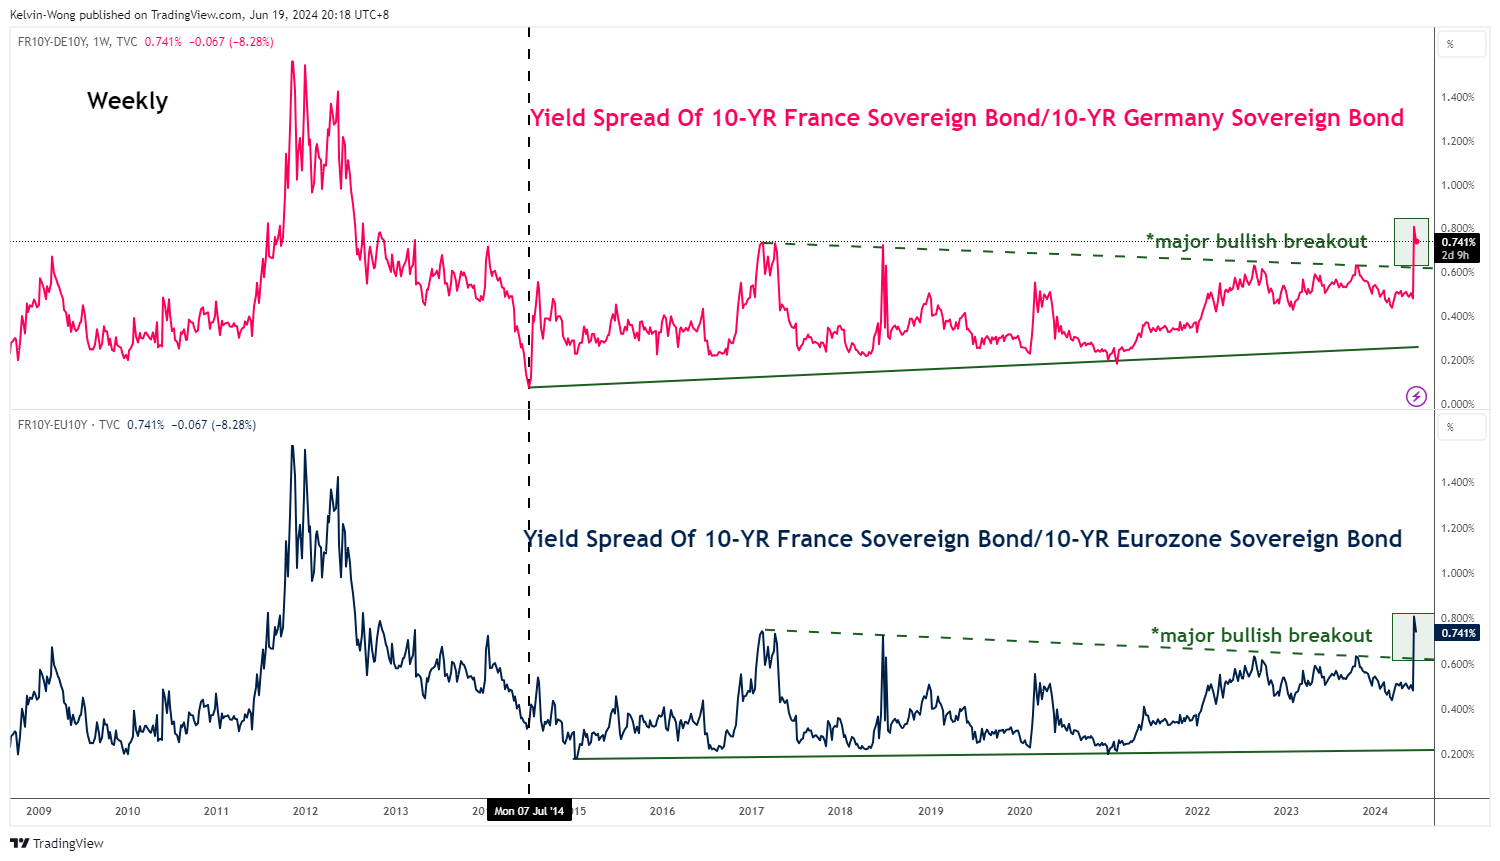
Fig 2: Yield spread of 10-year French & German government bonds as of 19 Jun 2024 (Source: TradingView, click to enlarge chart)
Increasing political clout gained by the French right-wing National Rally political party may hamper the growth prospect of the French economy as it tends to favour looser fiscal policies that may drive up the budget deficit which may eventually lead to higher taxes in the future.
The potential widening of France’s budget deficit through deeper expansionary fiscal policies pushed by the right-wing party may increase the credit risk factor in the market pricing mechanism on France government bonds, which is being reflected in the current movements of yield spread between the 10-year French and German government bonds.
The spread between the French and German 10-year government bond yields had widened to almost a 12-year high of 81 bps last Friday, 14 June. Even though it has eased off a bit since the start of this week, the spread is trading at an elevated level of 0.74% which still suggests political uncertainty in the Eurozone implied by the upcoming outcome of the French legislative election, in turn, drives the current downside pressure seen in the EUR/CHF cross pair (see Fig 2).
So far, the EUR/CHF has recorded three consecutive weekly losses of 4% since the end of May and started this week on a weak note as it printed an 18-week low of 0.9478 at this time of the writing.
A dovish SNB may halt the EUR/CHF bearish trend
On this Thursday, 20 June, the SNB will announce its latest quarterly monetary policy decision outcome. The SNB is well-known “notoriously” to surprise market participants, for example, its most recent unexpected 25 bps interest rate cut in March ahead of ECB, and the most shocking was the abandonment of the EUR/CHF fixed peg in January 2015.
Mixed speeches from SNB officials where they mentioned that they estimated that Switzerland’s real long-term neutral rate is to be anchored around zero. Given that its official policy interest rate is currently at 1.5% and inflation is at 1.4%, Hence, at these current rates, it imply there is still room for a cut.
On the other hand, SNB President Jordan has highlighted that a too-weak domestic currency is most likely the source of higher Swiss inflation. Therefore, such a remark supports the case of not cutting rates at this juncture to prevent imported inflation.
Hence, if the SNB decides to issue dovish guidance tomorrow, 20 June either by another surprise cut or by revising its inflation forecast downward, the Swiss franc may resume its bearish trend which is likely to see a potential floor at least in the short-term to halt the ongoing EUR/CHF weakness.
EUR/CHF short-term downtrend remains intact ahead of SNB
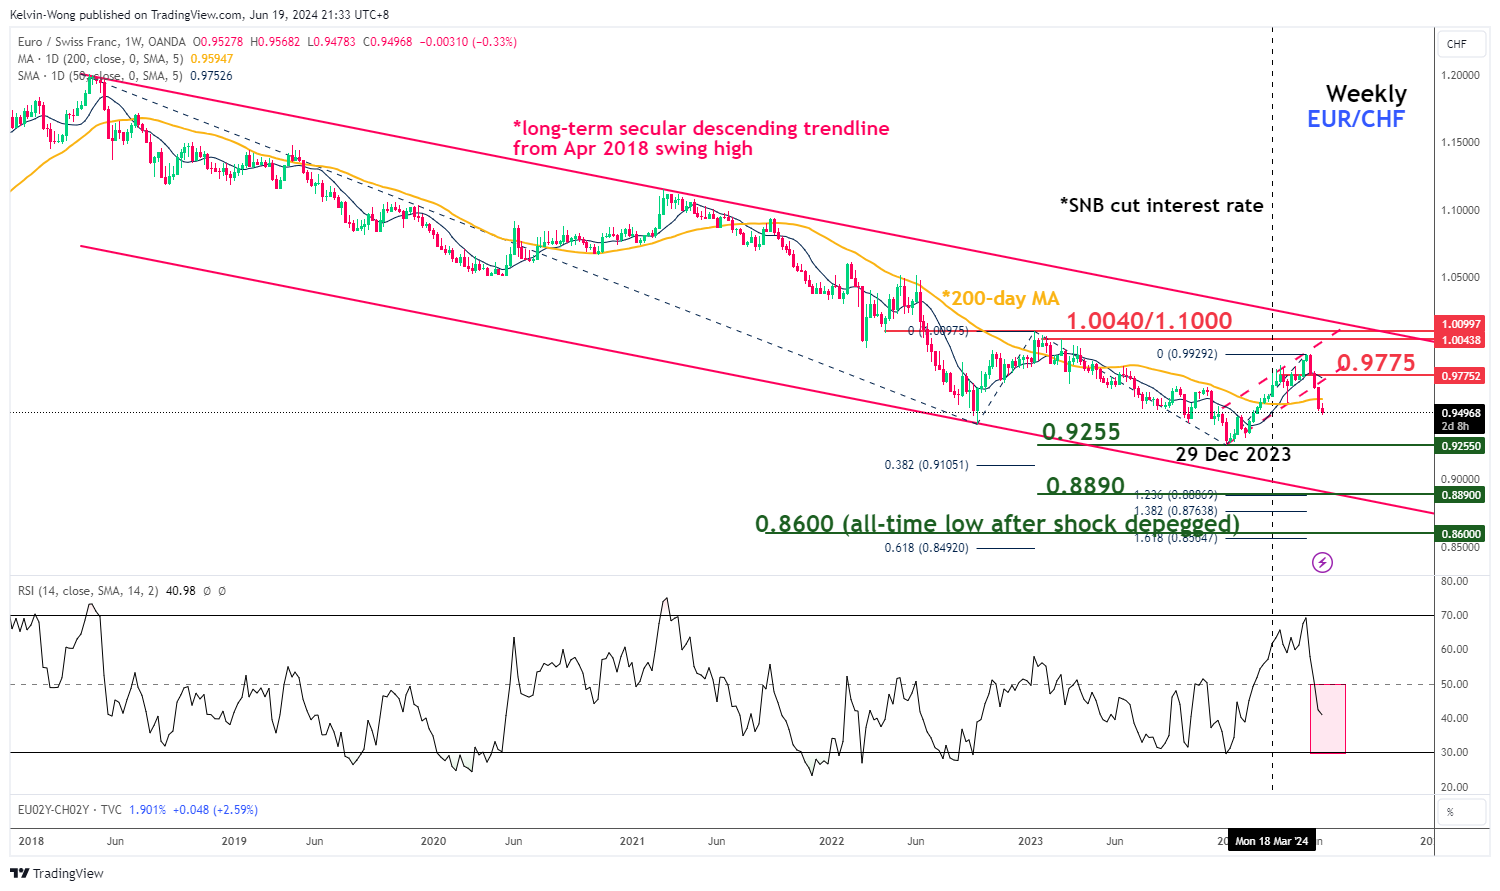
Fig 3: EUR/CHF long-term secular trend as of 19 Jun 2024 (Source: TradingView, click to enlarge chart)
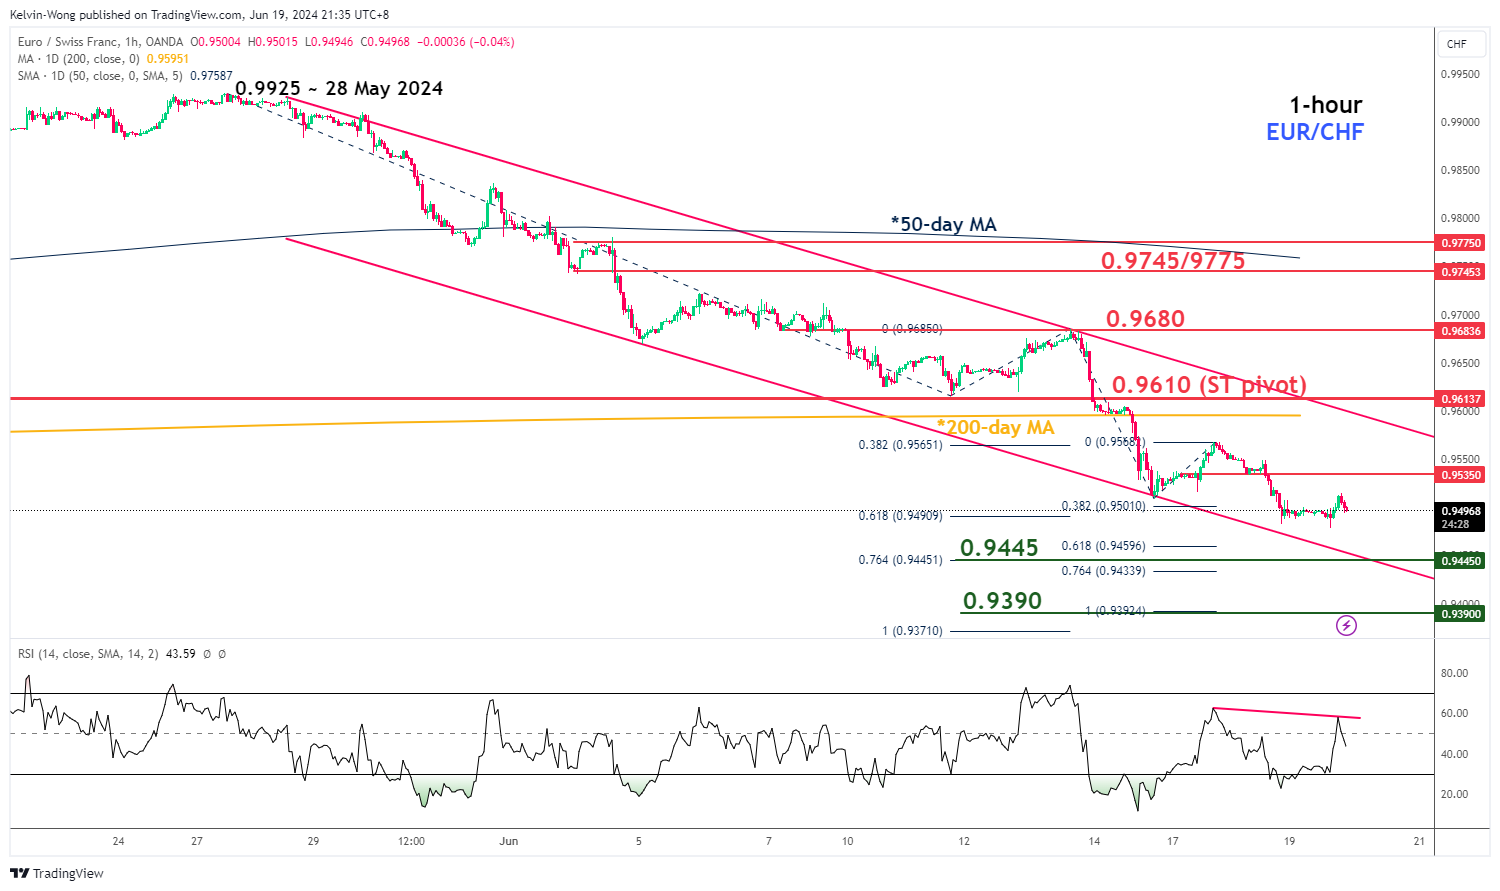
Fig 4: EUR/CHF short-term trend as of 19 Jun 2024 (Source: TradingView, click to enlarge chart)
Since the bearish breakdown from its 50-day moving average at the start of this month, 3 June, the price actions of the long-term secular downtrend phase in place since April 2018 (see weekly chart depicted in Fig 3) have resumed its major bearish impulsive sequence.
Current price actions in the past four weeks have continued to evolve within a minor descending channel in place since its minor swing high of 0.9925 printed on 28 May 2024 which suggests an ongoing minor downtrend phase.
In addition, the hourly RSI oscillator has continued to flash a bearish momentum condition as it continued to print “lower highs” below the 50 level.
If the 0.9610 short-term pivotal resistance (also confluences closely with the 200-day moving average) is not surpassed to the upside, another leg of the impulsive downmove sequence may unfold to expose the next near-term supports at 0.9445 and 0.9390 in the first step (see Fig 4).
On the other hand, a clearance above 0.9610 negates the bearish tone for a potential minor mean reversion countertrend rebound for the next intermediate resistances to come in at 0.9680 and 0.9745/9775 (also the 50-day moving average).
ECB’s Centeno: Ideal interest rates should approach 2%, avoiding zero
ECB Governing Council member Mario Centeno remarked today that "the cycle of interest rates will continue to evolve," signaling ongoing adjustments based on inflation trends. Centeno noted that rates "will fall if inflation helps us, which it's doing".
However, Centeno cautioned against a return to zero interest rates, stating, "It would be a very bad sign if that were to happen." Instead, he suggested that an ideal scenario would see interest rates approaching 2%. He emphasized that this level, with some fluctuations, would create a stable economic and financial environment for both the European and Portuguese economies in the future.
USD/CHF – Flat Ahead of SNB Rate Decision
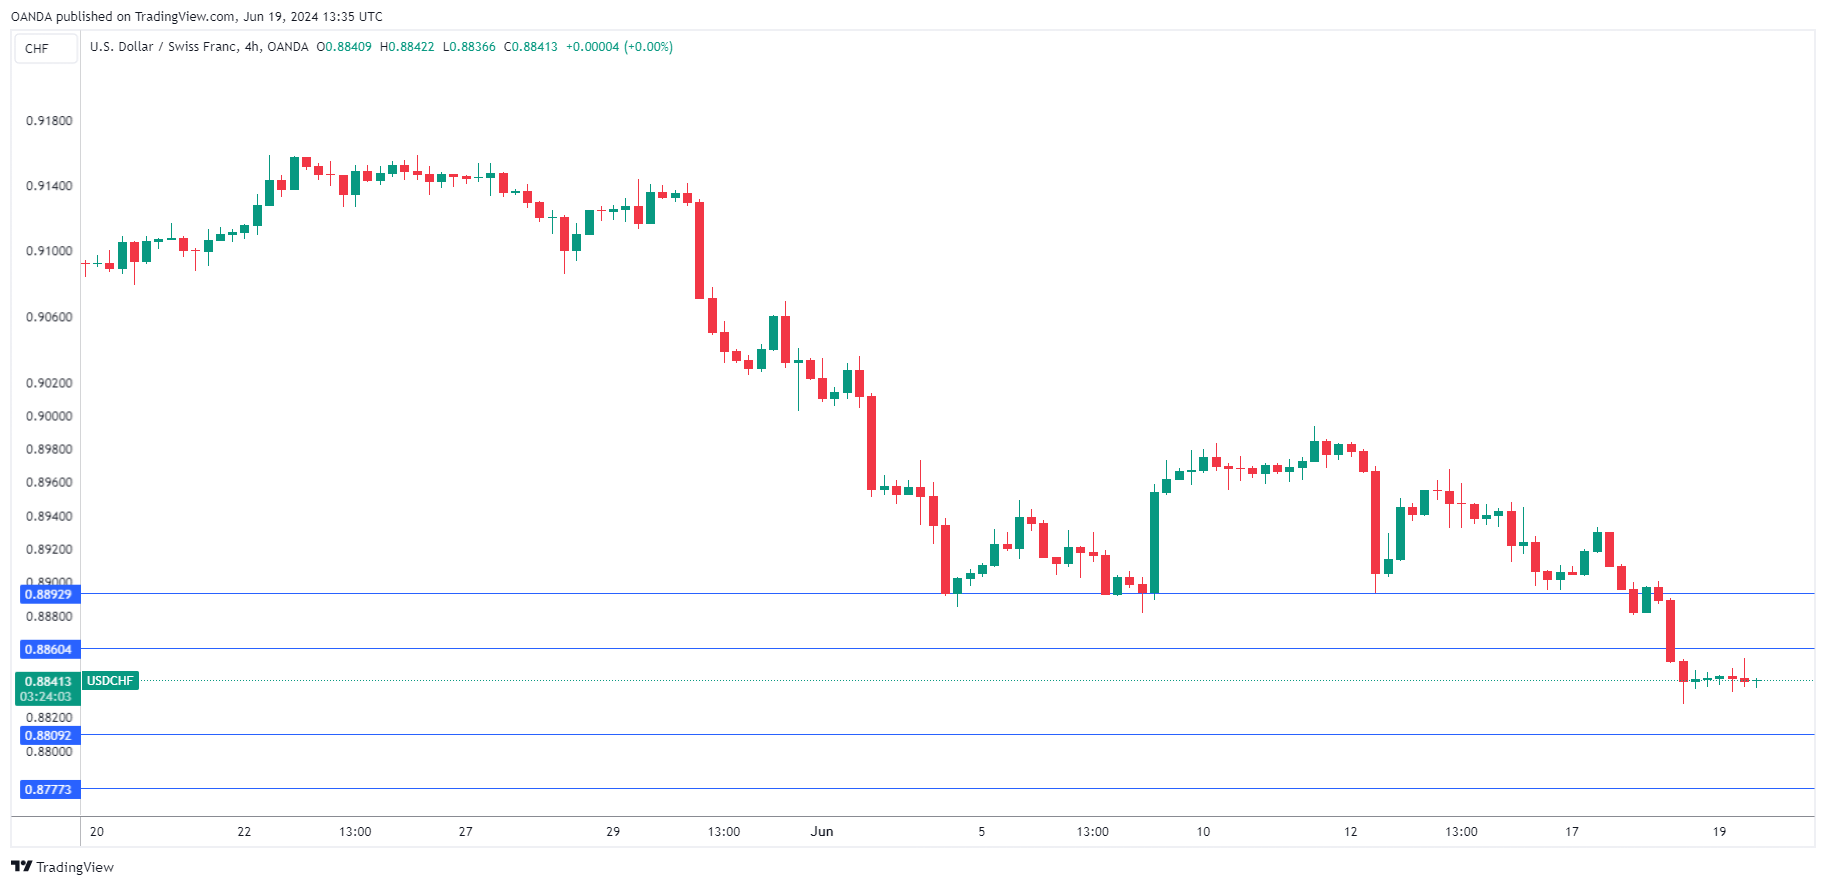
The Swiss franc is almost unchanged on Wednesday. USD/CHF is trading at 0.8838 in the North American session, down 0.04% on the day.
Will the Swiss National Bank cut rates again?
Switzerland’s central bank will announce its rate decision on Thursday and the markets are on edge. Will the Swiss National Bank lower rates or hold? The SNB last met in March and that meeting was memorable, as policy makers shocked the markets with a quarter-point cut, bringing the cash rate to 1.50%. Investors had expected the SNB to continue to maintain rates at the March 21st meeting, but the SNB decided to respond to declines in inflation and growth and became the first major central bank to lower rates this year.
The Swiss franc took a bath and fell 1.2% against the US dollar the day of the March meeting, its second-to-worst daily performance this year. The Swissie proceeded to lose more ground in the following weeks but has recovered almost completely. Economists are split 50/50 on whether the SNB will cut on Thursday, while the money markets have cut expectations of a rate cut to 60%, compared to 80% just one month ago. The ultra-cautious SNB has been mum, with no public comments from Bank policy makers over the past three weeks, which has only intensified the suspense.
Inflation has been steady in the upper half of the SNB’s target range of 0% to 2% and Swiss growth has been steady, which would support the case to hold rates. On the other hand, exports have been weak and the Swiss franc has appreciated 3.3% against the US dollar since May 30th. A rate cut by the SNB could weigh on the Swiss franc and make Swiss exports more attractive on world markets.
The uncertainty ahead of the SNB meeting makes this a live meeting and could translate into volatility from the Swiss franc on Thursday.
USD/CHF Technical
- There is support at 0.8809 and 0.8777
- 0.8860 and 0.8892 are the next resistance lines
USD/CHF Mid-Day Outlook
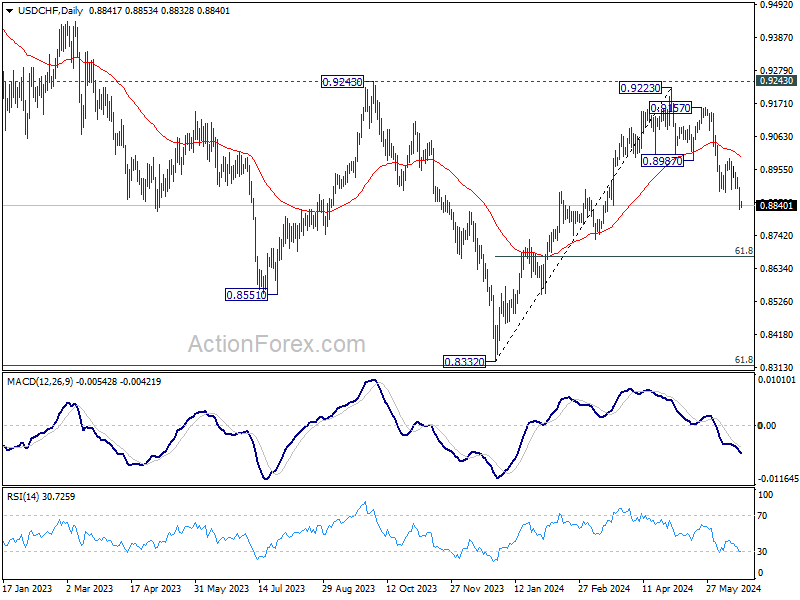
Daily Pivots: (S1) 0.8809; (P) 0.8860; (R1) 0.8892; More….
USD/CHF decline is still in progress and intraday bias remains neutral. Rise from 0.8332 could have completed at 0.9223, ahead of 0.9243 key resistance. Further fall would be seen to 61.8% retracement of 0.8332 to 0.9223 at 0.8672 next. On the upside, above 0.8880 will turn intraday bias neutral first. But risk will stay on the downside as long as 0.8992 resistance holds, in case of recovery.
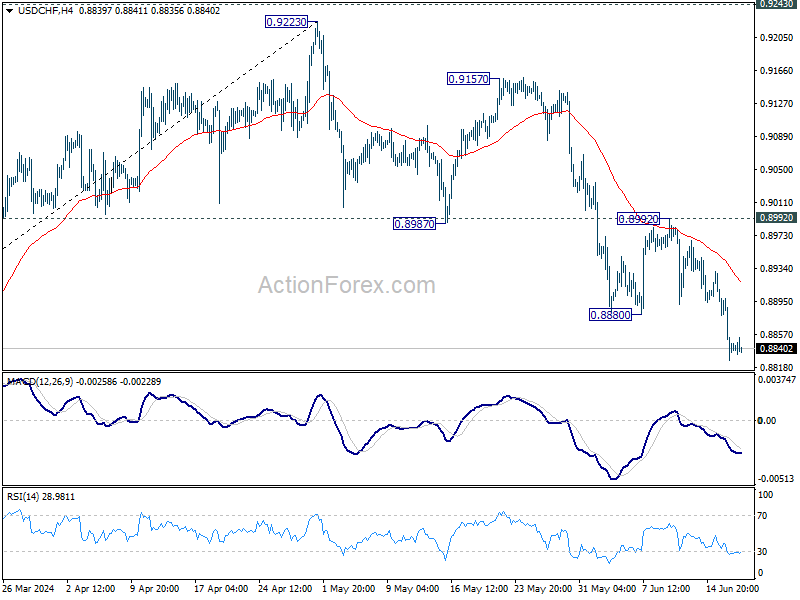
In the bigger picture, price actions from 0.8332 medium term bottom are seen as developing into a corrective pattern to the down trend from 1.0146 (2022 high). Rejection by 0.9243 resistance affirms this case, and maintains medium term bearishness. While more range trading could be seen between 0.8332/0.9243 first, downside break out is mildly in favor at a later stage.
EUR/USD Mid-Day Outlook
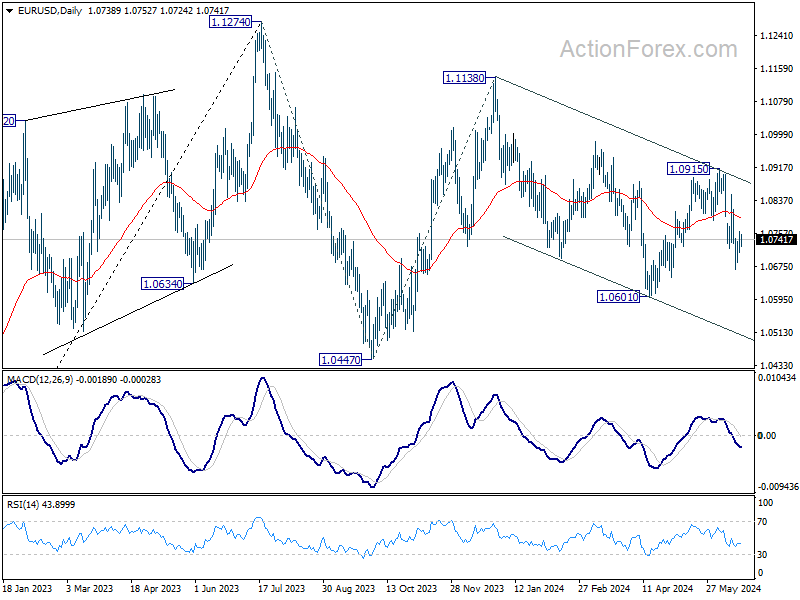
Daily Pivots: (S1) 1.0713; (P) 1.0737; (R1) 1.0765; More....
No change in EUR/USD's outlook and intraday bias remains neutral. More consolidations could be seen but further fall is expected as long as 55 4H EMA (now at 1.0760) holds. Fall from 1.0915 is seen as another leg in the larger corrective pattern. Below 1.0677 will target 1.0601 low first. Firm break there will target channel support at 1.0500 next.
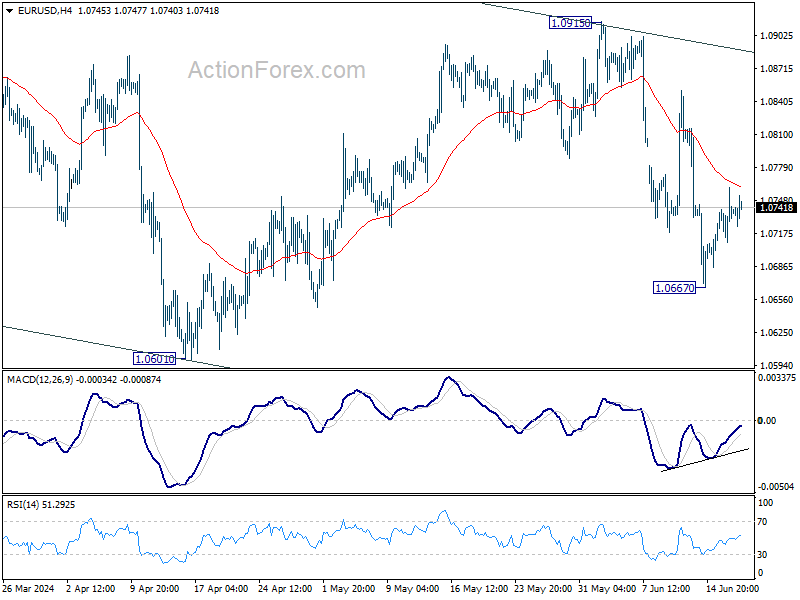
In the bigger picture, price actions from 1.1274 are viewed as a corrective pattern that's still in progress. Break of 1.0601 will target 1.0447 support and possibly further to 100% projection of 1.1274 to 1.0447 from 1.1138 at 1.0311. For now, this will remain the favored case as long as 1.0915 resistance holds, in case of rebound.
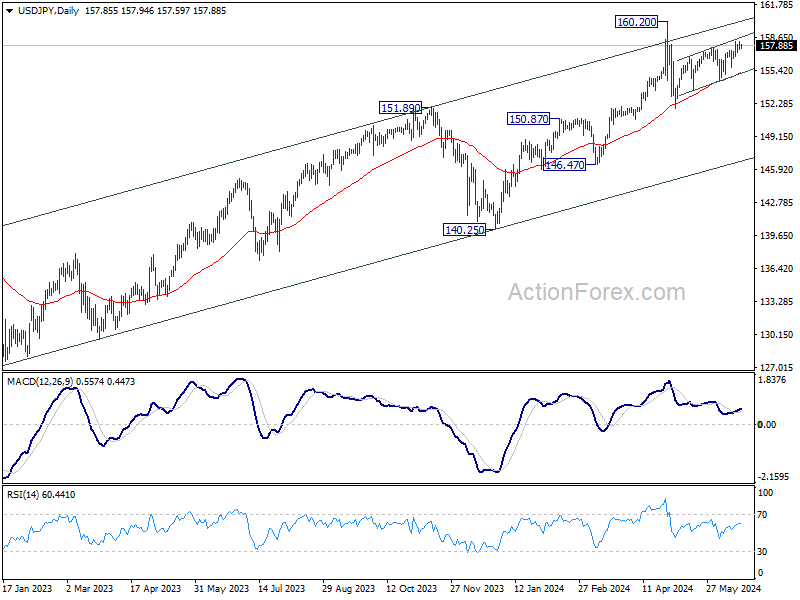
USD/JPY Mid-Day Outlook
Daily Pivots: (S1) 157.50; (P) 157.87; (R1) 158.21; More...
Intraday bias in USD/JPY remains neutral and outlook is unchanged. Further rally would be in favor as long as 154.53 support holds. Break of 158.25 will resume the choppy rise from 151.86 towards 160.20 high. But upside should be limited there, at least on first attempt.
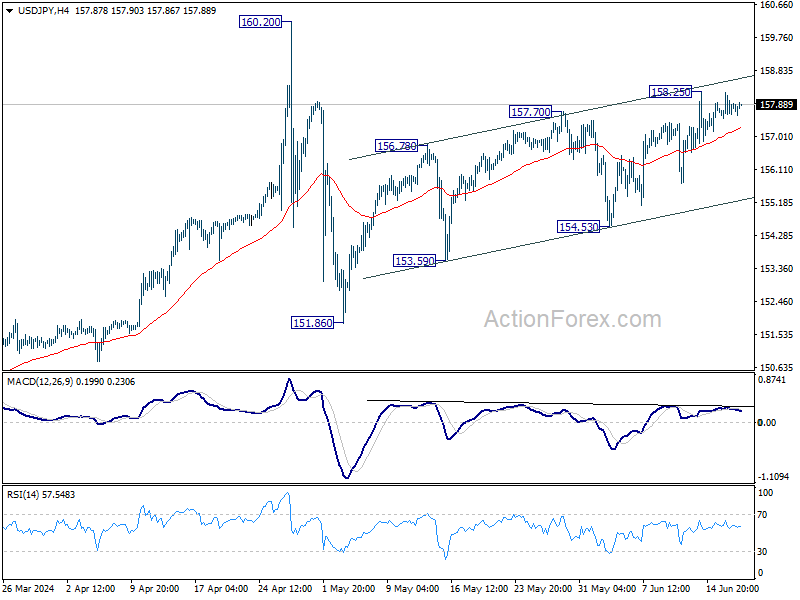
In the bigger picture, price actions from 160.20 medium term top are seen as a corrective pattern to rise from 150.25 only. Another rally is still expected at a later stage through 160.02 to resume the larger up trend. However, decisive break of 150.87 will argue that larger correction is possibly underway, and target 146.47 support next.